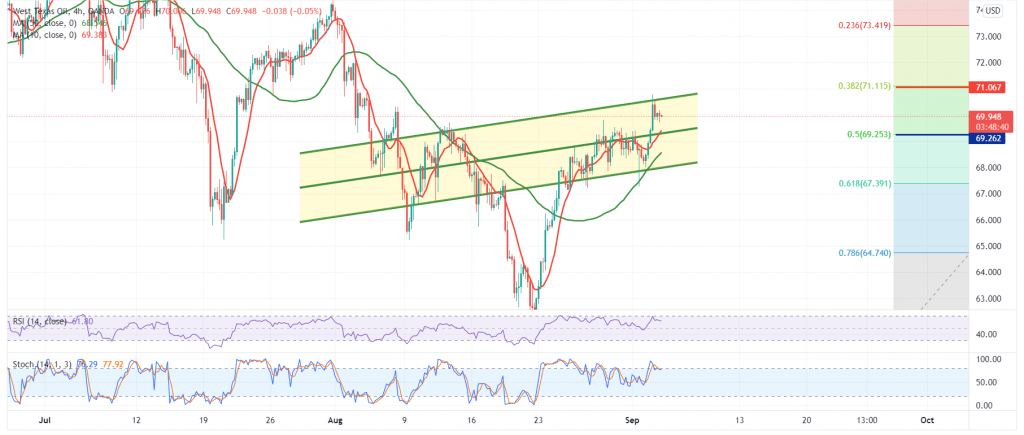
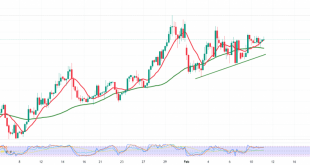
US crude oil futures prices found a strong resistance level as we mentioned in the previous analysis at 69.25, explaining that it represents one of the main trend keys that pushed oil prices.
Technically, we tend to be negative, but cautiously, relying on the stability of trading below the 69.25 resistance level, 50.0% Fibonacci as shown on the chart, in addition to the negative pressure of the 50-day moving average.
Today, we are targeting 68.00 and 67.65, respectively, and we should pay close attention if the pivotal support level is confirmed, which represents the key to protect the bullish trend. 67.40, 61.80% correction. This increases the strength of the bearish trend so that the way will be directly open towards 66.75 and 65.80 next targets.
Rising above the resistance level 69.25/69.30 will immediately stop any attempts to fall and lead oil to the official bullish path, with targets starting at 70.30 and extending later towards 71.10.
| S1: 67.65 | R1: 69.25 |
| S2: 66.75 | R2: 70.30 |
| S3: 65.80 | R3: 71.10 |
 Noor Trends News, Technical Analysis, Educational Tools and Recommendations

