
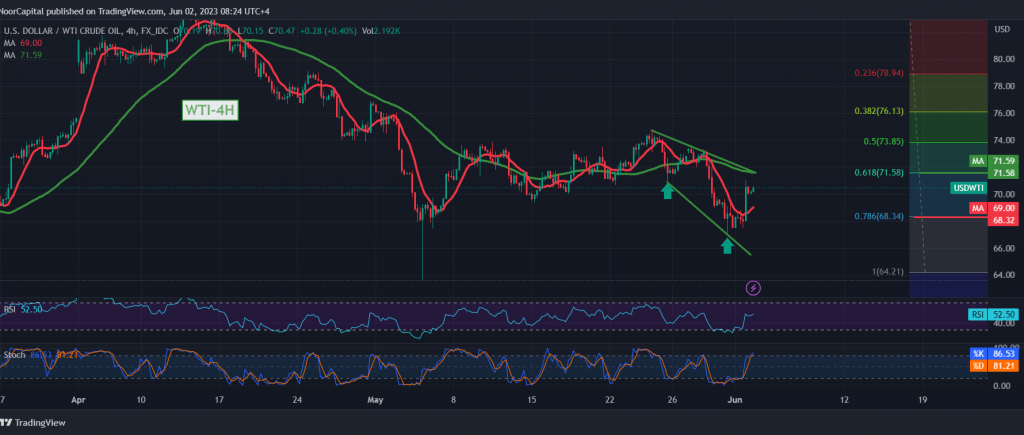
After several successive sessions of sharp decline, an upward trend returned to control the movements of US crude oil futures yesterday to establish a good support base of around 68.40.
Technically, we tend to rise during the day, relying on trading remaining above the support above 68.40, accompanied by the price receiving a positive impulse from the 50-day simple moving average, which comes in conjunction with the positive momentum signals from the 14-day momentum indicator on short-term intervals.
We aim to retest the previously broken support level that was transformed into a resistance level according to the concept of exchanging roles at 71.55, represented by Fibonacci correction 61.80%, as shown on the chart, and the price behavior of oil must be monitored around this level due to its importance to the general trend in the short term, and its breach leads oil To build a new rising wave, its next target is 73.10, as long as trading remains stable above 68.35.
The return of trading stability below 68.35 will immediately stop the suggested bullish scenario, as the negative pressure will start again, targeting 66.20.
Note: The risk level is high, and all scenarios will likely occur.
Note: Today we are awaiting high-impact economic data issued by the US economy, “US jobs data”, “average wages” and US unemployment rates, and we may witness a high fluctuation in prices at the time of the news release.
Note: Trading on CFDs involves risks. Therefore, all scenarios may be possible. This article is not a recommendation to buy or sell but rather an explanatory reading of the price movement on the chart.
| S1: |