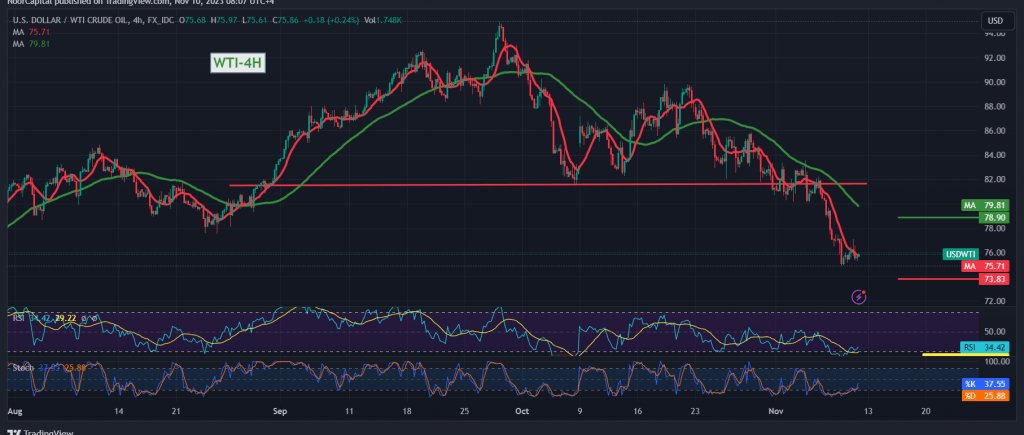
The crucial resistance level highlighted in the preceding technical report at $77.00 proved to be a formidable barrier, intensifying negative sentiments on US crude oil futures. The market maintained negative stability, reaching its nadir at $75.25 per barrel.
A detailed examination of the 240-minute timeframe chart reveals a sustained negative convergence of simple moving averages, accentuated by adverse crossover signals from the Stochastic indicator.
In this technical landscape, the bearish scenario remains the favored trajectory, with an initial target set at $75.10. A breach of this level would signify an extension of oil’s losses, with potential downward milestones at $74.30 and possibly further down to $73.80.
Any reversal of the current trend requires a decisive move, specifically an upward breakthrough and the consolidation of prices for at least one hour above $77.00. Such a development would postpone the likelihood of a decline, although it wouldn’t entirely negate the possibility. In the event of an upward move, we anticipate a retest of $78.00 and $78.60 before determining the next price destination.
Given the current market dynamics, risks are elevated.
Warning: Today’s market is poised for high-impact press talks, including a speech by Christina Lagarde, Governor of the European Central Bank. Additionally, significant economic releases are expected from the United Kingdom, such as the monthly GDP index, and from the United States, the “preliminary reading of the consumer confidence index” by the University of Michigan. Be prepared for potential high fluctuations in prices during these news releases.
Warning: The overall risk level remains elevated amid ongoing geopolitical tensions, contributing to the potential for heightened price volatility.”
Note: Trading on CFDs involves risks. Therefore, all scenarios may be possible. This article is not a recommendation to buy or sell but rather an explanatory reading of the price movement on the chart.
| S1: |
 Noor Trends News, Technical Analysis, Educational Tools and Recommendations

