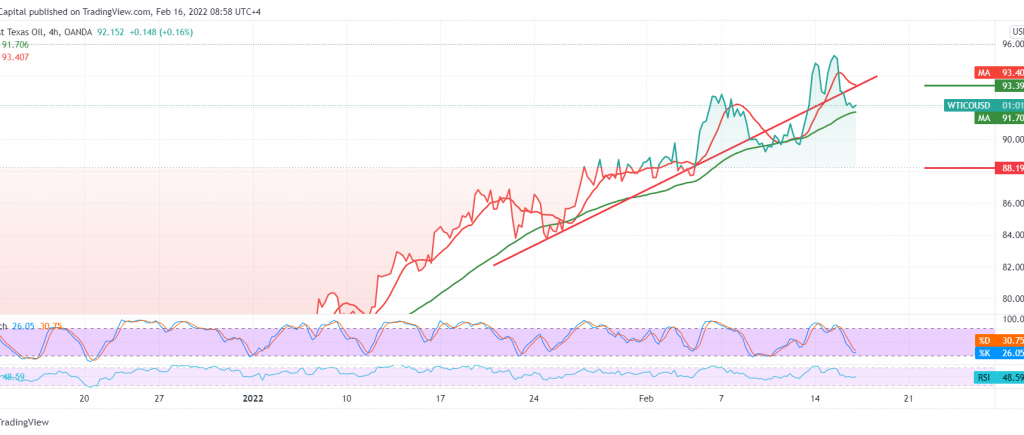
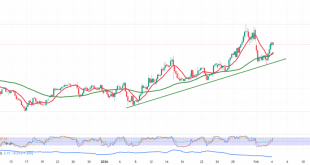
American crude oil prices formed an upside attack at the psychological barrier of $95.00 per barrel during the last trading session, which created an intense negative pressure to record the lowest level at 90.65.
Technically, looking at the 240-minute chart, we notice a clear breakout of the bullish price channel’s support line, which was confirmed to be broken around 93.20 and turned into a resistance level, in addition to the beginning of negative signs appearing on the 14-day momentum indicator on the short intervals.
Therefore, there may be a possibility of a bearish bias. Still, the condition of confirming the breach of 90.65 increases the strength of the bearish bias to visit the psychological barrier of 90.00, knowing that the decline below the mentioned level leads oil prices to achieve more declines towards 88.20 as long as the price is stable below 93.20.
Note: IEA report is due today and may cause volatility.
Note: The risk level is high.
Note: Trading on CFDs involves risks. Therefore, all scenarios may be possible. This article is not a recommendation to buy or sell but rather an explanatory reading of the price movement on the chart.
| S1: 90.00 | R1: 94.45 |
| S2: 88.15 | R2: 96.90 |
| S3: 85.70 | R3: 98.80 |
 Noor Trends News, Technical Analysis, Educational Tools and Recommendations

