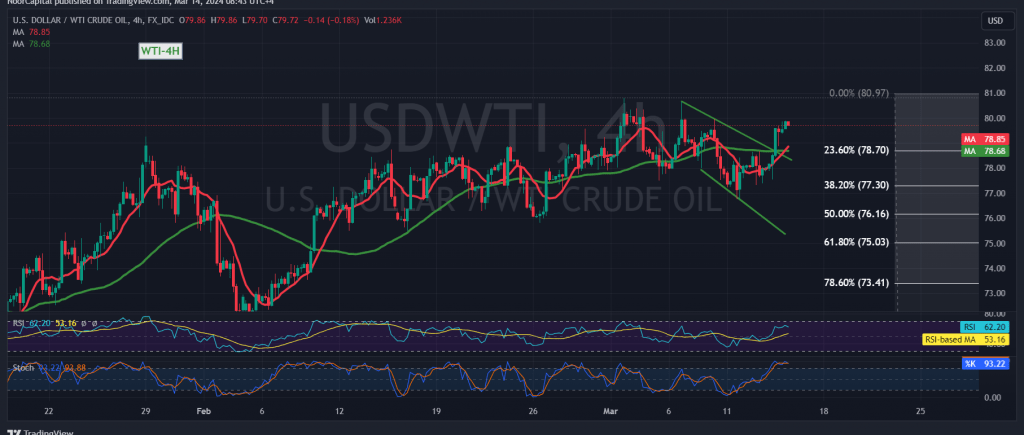
Over the past two consecutive sessions, our focus has been on monitoring the price behavior of oil due to conflicting technical signals and trading confined within defined trend boundaries. As previously highlighted in our technical report, an upward trend commenced upon crossing above the resistance level of 78.70, representing the Fibonacci retracement at 23.60%. This breakthrough paved the way for a visit to the initial target at 79.40, with the highest level recorded at $79.86 per barrel.
From a technical standpoint, we maintain a positive outlook for trading, relying on the stability of prices above the previously breached resistance level of 78.50. Additionally, the price is receiving a positive stimulus from the 50-day simple moving average.
Consequently, our bias leans towards upward movement during the day, with an initial target set at 80.55. It’s worth noting that surpassing this level could extend oil’s gains, potentially leading to further upward movement towards 81.30.
However, it’s essential to acknowledge that a breach below the levels of 78.50 to 78.30 could disrupt the proposed scenario, potentially resulting in a negative trading session aimed at retesting 76.80.
Investors should exercise caution, especially considering the high-impact economic data expected from the American economy today, including core monthly and annual producer prices, producer prices, and retail sales. These releases may contribute to increased price volatility.
Given the ongoing geopolitical tensions, the risk level remains elevated, and investors should implement appropriate risk management strategies to navigate potential market fluctuations effectively.
Note: Trading on CFDs involves risks. Therefore, all scenarios may be possible. This article is not a recommendation to buy or sell but rather an explanatory reading of the price movement on the chart.
| S1: |
 Noor Trends News, Technical Analysis, Educational Tools and Recommendations

