
After a sustained period of strong declines, U.S. crude oil prices staged a bullish technical rebound in the previous session, reaching a session high of $68.25 per barrel.
Technical Outlook – 4-Hour Chart
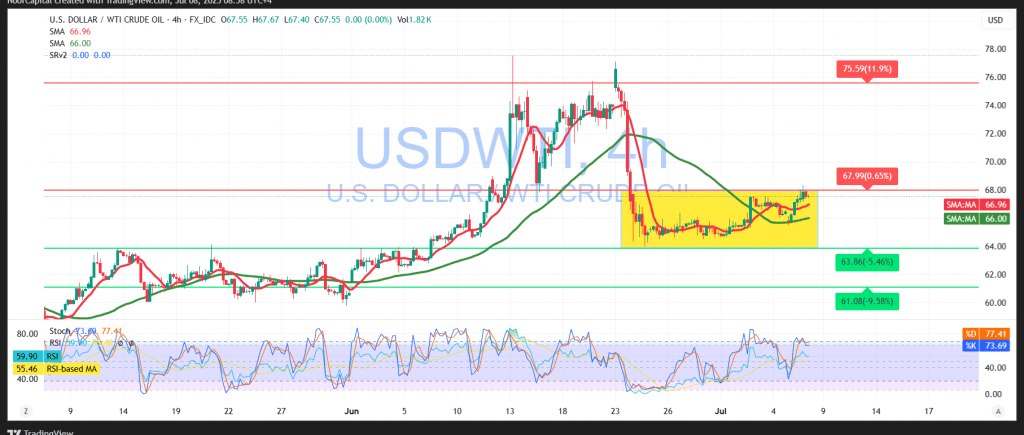
The current technical landscape reveals mixed signals:
- The simple moving averages have shifted to provide support from below, indicating a modest recovery in bullish momentum.
- However, emerging negative divergence on the Relative Strength Index (RSI) suggests that the upside may be capped in the short term.
Given these conflicting signals, close observation of price action is warranted. Two potential scenarios emerge:
Positive Scenario
A confirmed breakout above the $68.00 psychological resistance could affirm continued bullish momentum. This move may target:
- $68.70 as the initial resistance, and potentially
- $69.70 if momentum builds further
Negative Scenario
Failure to breach $68.00, followed by a decisive breakdown below $66.95, would signal renewed bearish control. In this case, downside targets may include:
- $66.00 as the first support, with extended losses potentially testing lower levels
Conclusion
Traders should remain cautious, as oil remains sensitive to geopolitical risks and macroeconomic developments.
Warning
Volatility is expected to remain elevated amid ongoing trade and geopolitical tensions. All scenarios remain possible. Use prudent risk management.
Caution: In the context of ongoing global trade tensions and broader economic uncertainty, volatility may remain elevated. Manage risk accordingly, as all outcomes remain on the table.
| S1: |