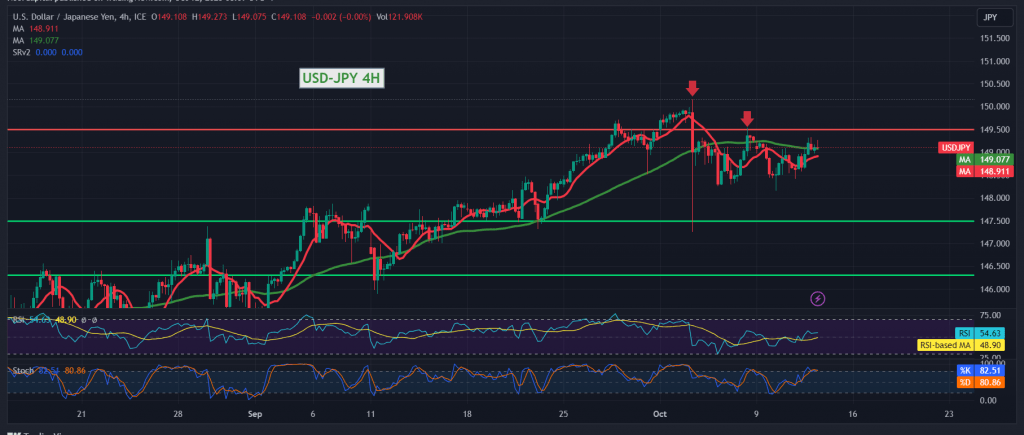
Limited positive attempts were witnessed the movements of the USD/JPY pair during the transactions of the previous trading session within a gradual rise to retest the resistance level published during the previous report 149.30, but unable to break it.
On the technical side today, we find the 50-day simple moving average trying to push the price higher, accompanied by intraday trading stability above the support level of 149.00, which supports limited positivity. On the other hand, negative features begin to appear on the Stochastic indicator and begin to lose bullish momentum, coinciding with trading stability below 149.30 plus a bearish technical formation in the making.
With conflicting technical signals, we prefer to monitor price behaviour, facing one of the following scenarios:
Confirmation of breaching the 149.30 resistance level is a motivating factor that enhances gains to visit 149.50 and 149.85, while trading stability below 148.60. From here, the downward trend returns to controlling the pair’s movements, and we witness a bearish correction, targeting 148.00 and 147.70.
Note: Today we are awaiting highly influential economic data issued by the American economy, the “Consumer Price Index,” and we may witness high volatility when the news is released.
Note: Trading on CFDs involves risks. Therefore, all scenarios may be possible. This article is not a recommendation to buy or sell but rather an explanatory reading of the price movement on the chart.
| S1: |
 Noor Trends News, Technical Analysis, Educational Tools and Recommendations

