
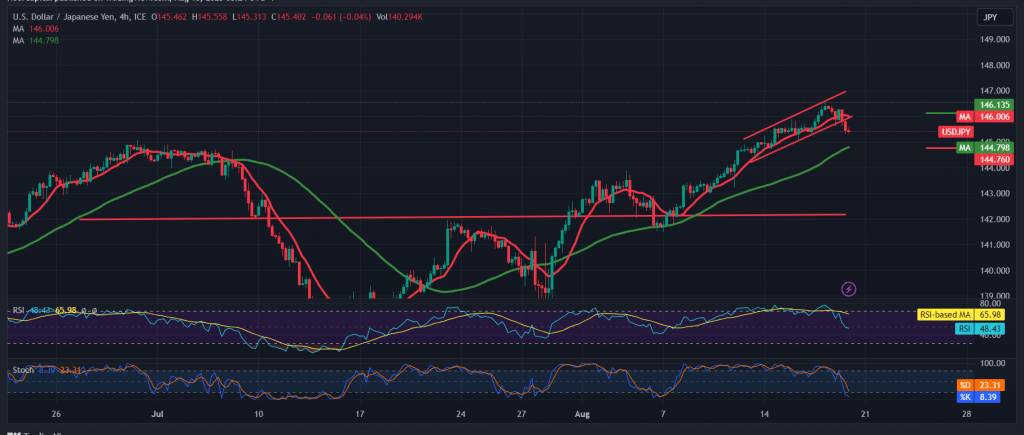
The dollar-yen pair moved noticeably during the previous trading session within the expected bullish path, approaching the target of 146.85 by a few points to record its highest price at 146.60.
On the technical side today, the current movements of the pair are witnessing a bearish tendency after several successive sessions of the upside, to find it challenging to breach 146.60 level, the stochastic indicator is gradually losing momentum on the 4-hour time frame, and we may witness a bearish tendency during the coming hours that does not contradict the general bullish trend.
From here, with steady intraday trading below 146.10/146.00, we aim to retest 144.90 as a first target, and it may extend to test the 50-day simple moving average around 146.60 before starting the rise again.
Trading stability above 146.10, leading the pair to complete the official bullish path, waiting to touch 146.60 and 147.00, respectively.
Note: Trading on CFDs involves risks. Therefore, all scenarios may be possible. This article is not a recommendation to buy or sell but rather an explanatory reading of the price movement on the chart.
| S1: |