
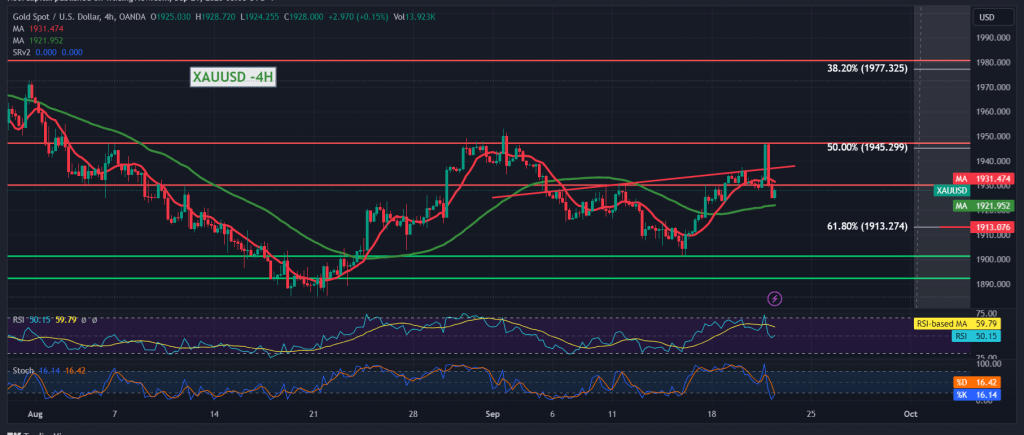
Gold prices touched the upward targets required to be achieved during the previous trading session, ahead of the Fed’s decision, heading towards the official stop of 1945, recording its highest level of $1947 per ounce.
On the technical side today, gold prices witnessed a bearish tendency as a result of hitting the resistance at 1945 , represented by the 50.0% Fibonacci retracement, which forced the price to retest 1924, and with a closer look at the 4-hour time interval chart, we find the 50-day simple moving average still holding. The price is from below and meets near the 1922 support level, adds more strength to it, and we find the Stochastic indicator trying to obtain positive crossover signals.
We tend to go higher cautiously, with trading remaining above 1922. We also need to witness the price consolidating again above 1930, which is a motivating factor that enhances the chances of touching 1941 and 1945, respectively, knowing that the price’s consolidation above 1945 initially leads gold prices towards 1955.
We remind you that sneaking below 1922 with at least an hour candle closing below it can thwart the bullish scenario and leading gold prices to retest the main support for the current trading levels at 1913. It should also be noted that breaking 1913 increases and accelerates the downward slope, opening the door directly towards 1900 and 1895.
Warning: Today we are awaiting high-impact economic data issued by the British economy: the Monetary Policy Committee’s vote on interest rates, the interest rate decision, and the monetary policy summary. We are waiting for the “Unemployment Benefits” indicator from the United States of America, and we may witness high price fluctuations at the time of the news release.
Note: Trading on CFDs involves risks. Therefore, all scenarios may be possible. This article is not a recommendation to buy or sell but rather an explanatory reading of the price movement on the chart.
| S1: |