
Analysis of Market Movements and Technical Signals
Gold prices faced downward pressure during the initial trading sessions of the week, driven by the strength of the US dollar following robust US jobs data. Despite this decline, conflicting technical signals present a mixed outlook for gold’s trajectory.
Market Dynamics
Impact of Dollar Strength and US Jobs Data
The rise of the US dollar, fueled by the acceleration in US jobs data growth, contributed to the decline in gold prices. This resulted in gold reaching its lowest level at $2014 per ounce.
Technical Analysis
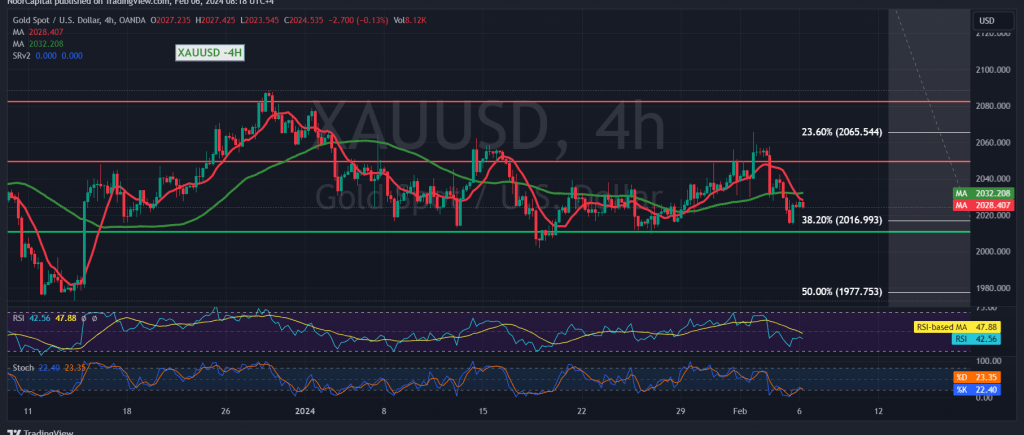
50-Day Simple Moving Average and Fibonacci Retracement
On the technical front, a closer examination of the 240-minute time frame chart reveals that the 50-day simple moving average is exerting downward pressure on the price. However, gold has returned to stability above a key support level situated at the Fibonacci retracement of 38.20%, indicating the potential for an upward trend.
Potential Scenarios and Targets
Scenario 1: Bearish Correction
Should trading stability return below the 2016 level, gold may enter a strong bearish correction. Targets for this correction could range from 1998 to 1983, with the official breakout target around 1977, representing the 50.0% correction.
Scenario 2: Bullish Recovery
Conversely, if trading stability is regained above the 2035 level, particularly 2040, gold prices may quickly recover. Official targets for such a recovery could include 2054 and 2065 as key stations.
Risk Assessment
High Risk Level
It’s essential to note that the risk level associated with trading gold at this juncture is high. Conflicting technical signals and the dynamic nature of market movements necessitate cautious observation of price behavior to identify high-quality trading opportunities.
Conclusion and Tactical Considerations
Monitoring Price Behavior
Given the conflicting signals and heightened risk level, a prudent approach would involve closely monitoring gold’s price behavior to discern the most favorable trading scenarios. Adhering to strict risk management protocols and remaining vigilant for potential shifts in market dynamics will be crucial for navigating the current environment effectively.
Note: Trading on CFDs involves risks. Therefore, all scenarios may be possible. This article is not a recommendation to buy or sell but rather an explanatory reading of the price movement on the chart
| S1: |