
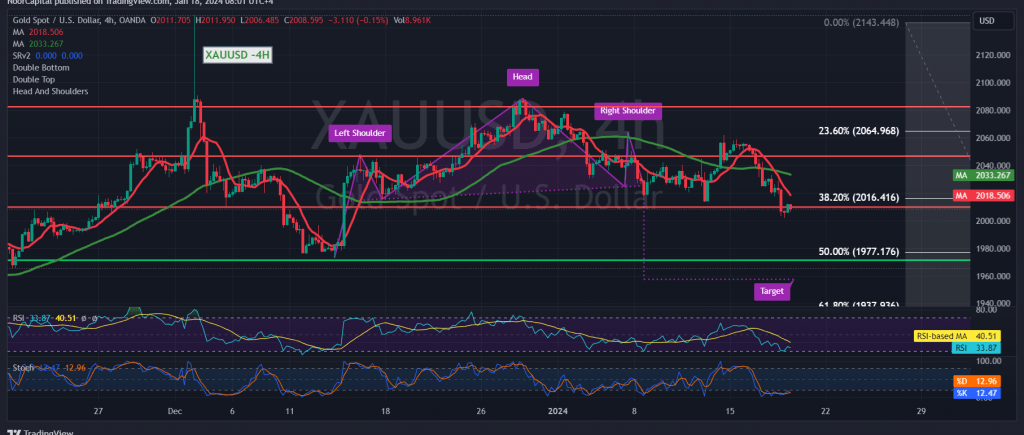
Gold prices experienced significant losses in the last trading session, aligning with the anticipated negative trend outlined in the previous technical report. The prices touched the official target by breaking the support at $2016, reaching $2000 per ounce.
In the current technical analysis, focusing on the 240-minute chart, the price remains below the crucial support level of 2016, representing the 38.20% Fibonacci retracement. The simple moving averages maintain a negative alignment, continuing to exert downward pressure on the price.
Consequently, the projection is for the ongoing corrective downward trend to persist, targeting $1995 as the initial objective. Breaking this level would further enhance and accelerate the corrective decline towards $1982, with a potential extension towards $1975.
It’s crucial to note that a return to stability in trading above the previously breached support (converted to the 2016 resistance level) and, more importantly, consolidation above $2025, has the potential to completely negate the proposed scenario. In such a case, gold prices might retest $2044 and $2057 directly.
Warning: The risk level is high.
Warning: Elevated risk persists amid ongoing geopolitical tensions, contributing to potential high price volatility.
Note: Trading on CFDs involves risks. Therefore, all scenarios may be possible. This article is not a recommendation to buy or sell but rather an explanatory reading of the price movement on the chart
| S1: |