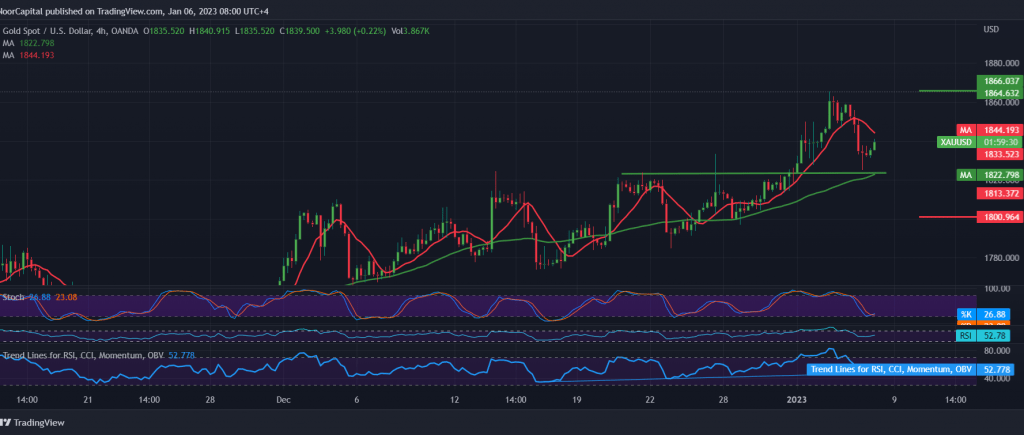
Gold prices came under negative pressure during the previous trading session, recording a low of $1825 per ounce, stable below the support of the bullish channel.
Technically, and despite the decline witnessed by gold prices, it is still stable above the main support floor published during the previous analysis, at 1822, and by looking at the 240-minute chart, we find that the stochastic indicator is trying to gain additional momentum in addition to the continuation of gaining momentum. On a positive impulse from the simple moving average, which meets around the main support floor 1822 and adds more strength.
Therefore, the bullish scenario remains the most preferable, targeting 1856, knowing that its breach facilitates the task required to visit 1865 and 1870 respectively, and we must be careful that price consolidation above 1873 increases and accelerates the strength of the bullish trend, to be waiting for 1880 next station.
The decline below 1822 will immediately stop attempts to rise and start negative pressure on gold prices, so we will be waiting for an ounce of gold around 1800 and 1797.
Note: Today, we are awaiting high-impact data from the United States of America, “American jobs data, average wages and unemployment rates,” and we may witness high volatility at the time of the news.
Note: Trading on CFDs involves risks. Therefore, all scenarios may be possible. This article is not a recommendation to buy or sell but rather an explanatory reading of the price movement on the chart.
| S1: |
 Noor Trends News, Technical Analysis, Educational Tools and Recommendations

