
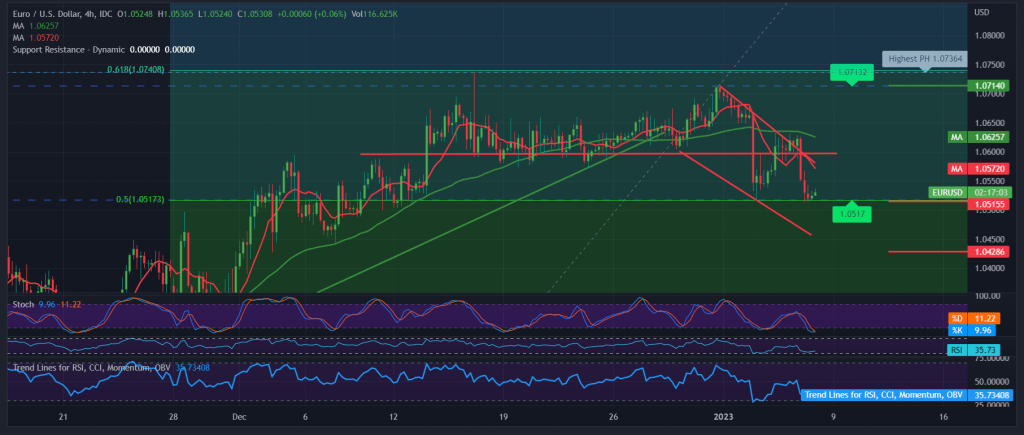
We remained neutral during the previous report, for the second session in a row, due to a contradiction between the technical signals, as the movements of the Euro-dollar pair witnessed a downward trend, recording its lowest level at 1.0520.
On the technical side, we previously indicated that the support level at 1.0520 constitutes the key to protecting the bearish trend. It meets around Fibonacci correction 50.0% as shown on the 4-hour chart. We also indicated yesterday that the trading levels are still confined from the bottom above 1.0520 and from the top below 1.0630.
Looking closely, we notice the simple moving averages pressuring the price from above, and this comes in conjunction with the negative signs coming from the RSI. On the other hand, the pair is stable above the main support 1.0520, accompanied by positive signs that started to appear on the stochastic.
With the continuation of the conflicting technical signals for the third consecutive session, in addition to the confinement of trading in a sideways path within the levels above, we prefer to monitor the price behavior to obtain a high-quality deal, to be in front of one of the following scenarios:
To confirm the downside trend, we need to witness a break of 1.0520, and from here, the euro-dollar pair starts a falling wave, with its official target around 1.0430/1.0450, and extends towards 10380.
To get an upward trend, we need to witness the price consolidating above the broken support level 1.0600, and most importantly 1.0630, to target 1.0670, and then 1.070, the 61.80% correction, as an official station.
Note: Today, we are awaiting high-impact data from the United States of America, “American jobs data, average wages and unemployment rates,” and we may witness high volatility at the time of the news.
Note: Trading on CFDs involves risks. Therefore, all scenarios may be possible. This article is not a recommendation to buy or sell but rather an explanatory reading of the price movement on the chart.
| S1: 1.0490 | R1: 1.0600 |
| S2: 1.0450 | R2: 1.0670 |
| S3: 1.0380 | R3: 1.0740 |


