
Gold prices surged in the latest trading session, surpassing the targets outlined in technical reports from the previous week. The precious metal reached a peak of $2118 per ounce, marking a significant milestone in its upward trajectory.
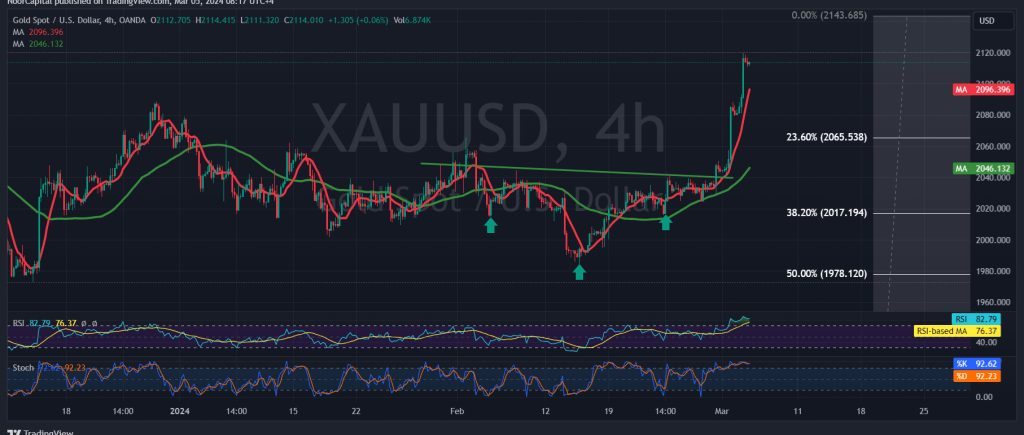
Analyzing the 4-hour chart through a technical lens reveals that the simple moving averages continue to provide support for the ongoing uptrend, accompanied by clear positive signals on the 14-day momentum indicator.
With gold prices holding steady above the previously breached resistance level of 2088, as well as the critical level of 2065 which now acts as pivotal support, the bullish momentum remains intact. The Fibonacci retracement of 23.60% further reinforces this upward trend, with potential targets set at the previous peak of 2118 followed by 2143.
It’s important to note that a failure to maintain positive stability above 2065 could lead to downward pressure, triggering a corrective decline aimed at retesting support levels at 2048 and 2016.
However, it’s worth mentioning that the Stochastic indicator is currently in overbought territory, indicating the possibility of some fluctuation until a definitive direction is established.
Given the high-risk environment, particularly amidst ongoing geopolitical tensions, caution is advised. Additionally, with high-impact economic data, such as the Services Purchasing Managers’ Index issued by the ISM, expected from the American economy today, heightened volatility in gold prices can be anticipated.
while the bullish trend remains dominant, investors should remain vigilant and closely monitor market developments and economic indicators for potential shifts in direction.
Note: Trading on CFDs involves risks. Therefore, all scenarios may be possible. This article is not a recommendation to buy or sell but rather an explanatory reading of the price movement on the chart
| S1: |