
Gold (XAU/USD) Technical Analysis
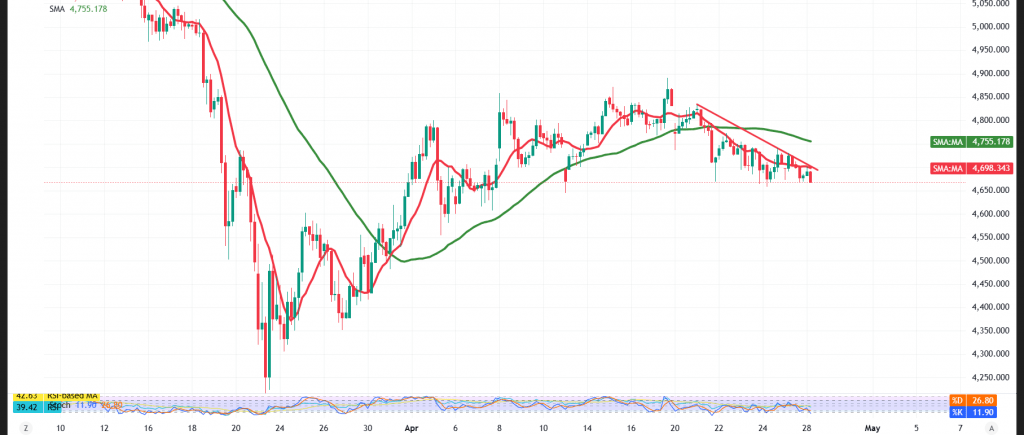
Gold prices (XAU/USD) endured a negative trading session during the previous period, encountering intense selling pressure that drove the metal beneath the pivotal support level at $4,700 — a development that underscores the continued dominance of sellers in the short-term landscape.
Technical Outlook – 4-Hour Timeframe:
With respect to intraday dynamics, the outlook remains cautious with a bearish tilt, as the price continues to trade below the simple moving averages, which are functioning as dynamic resistance and reinforcing the prevailing downtrend.
Additionally, the price is moving along a descending trendline, further validating the likelihood of sustained selling pressure throughout the current phase.
On the flip side, the Relative Strength Index (RSI) has started to display modest positive divergence after dipping into oversold territory — a signal that could pave the way for a deceleration in the decline or even a temporary corrective bounce.
We favor a watchful approach to price action until a clearer directional bias emerges, which would unfold under one of the following scenarios:
Bearish Scenario:
A confirmed breakdown below $4,666 would likely extend the downside momentum toward:
- $4,646 as the initial target
- Followed by $4,625 as the subsequent level
Bullish Scenario:
Alternatively, should the price reclaim and hold above $4,710 with a confirmed hourly candle close, this would set the stage for a corrective rebound targeting:
- $4,750 as the initial upside objective
Disclaimer: Trading gold carries substantial risk and may not be suitable for all investors.
Risk Alert: Risk levels remain elevated amid persistent trade frictions and geopolitical tensions — all scenarios should be considered plausible.
Risk Disclaimer: Trading CFDs involves risks, and therefore all scenarios may be plausible. The content above is not a recommendation to sell or buy but rather an explanatory reading of price movement on the chart.
| S1: 4646.00 | R1: 4710.00 |
| S2: 4625.00 | R2: 4750.00 |
| S3: 4583.00 | R3: 4772.00 |


