
Gold prices exhibited diverse movements, initially achieving the first upward target as indicated in the previous report, reaching the price of 2076 and marking a peak at 2078. However, subsequent negative pressure led to a decline, and the price recorded $2055 per ounce.
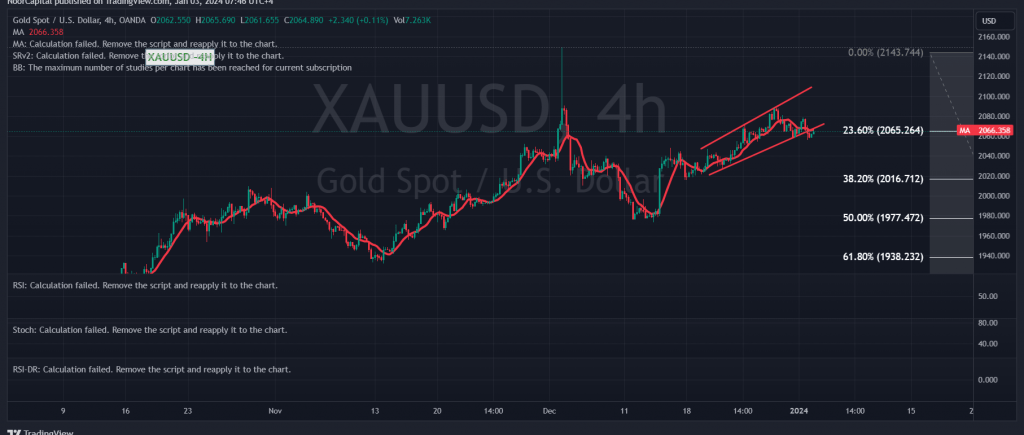
From a technical analysis perspective today, a closer examination of the 4-hour time frame chart reveals a momentary stabilization of the price below the 2065 level. This level is crucial as it represents the key to the trend for the day and is situated around the 23.60% Fibonacci retracement. The 50-day simple moving average is exerting downward pressure on the price from above, accompanied by evident negative signals on the Stochastic indicator.
As long as daily trading remains below the main resistance level of 2076/2078, there is a likelihood of a negative trading session. Breaking below 2053 may facilitate the path for a visit to 2045 and 2042, with further potential losses extending towards 2016.
On the contrary, if gold prices manage to consolidate above 2065, and the price subsequently breaches 2078, the official upward trend is likely to resume. In such a scenario, we anticipate waiting for gold to reach around 2088 and 2099 per ounce. It’s crucial for traders to monitor these key levels and indicators to navigate the potential market movements effectively.
A cautionary note is warranted today as high-impact economic data related to the American economy (FOMC Minutes, ISM Manufacturing PMI, and JOLTS Job Openings) is anticipated. This may result in increased volatility during the release of these news items. Traders are advised to exercise vigilance and consider the potential market reactions to these events.
Note: Trading on CFDs involves risks. Therefore, all scenarios may be possible. This article is not a recommendation to buy or sell but rather an explanatory reading of the price movement on the chart.
| S1: |