
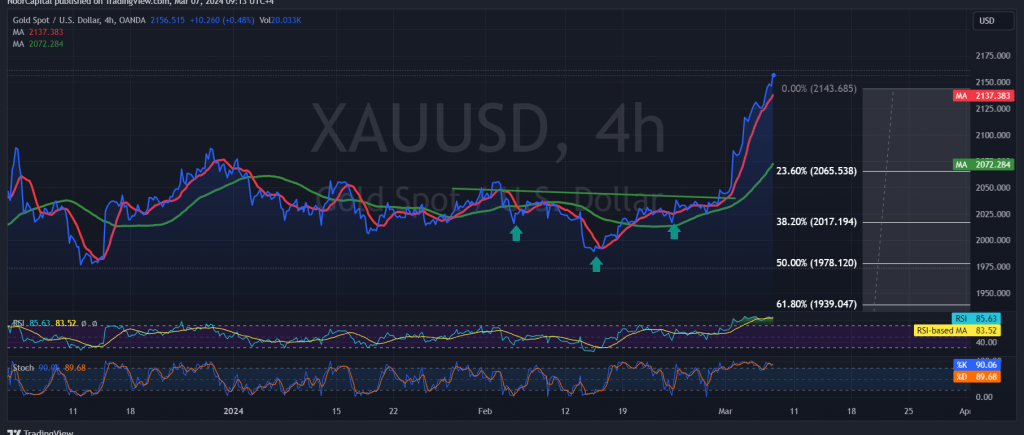
Gold prices have continued their remarkable ascent, defying our earlier anticipation of a bearish trend. In our previous report, we emphasized the significance of trading below the historical resistance level of 2144. However, with the price surging beyond this historical peak, reaching $2161 per ounce at the opening of today’s session, our short position has been replaced.
Today’s technical analysis, focusing on the 4-hour time frame chart, reveals a solid support base forming around 2132, with simple moving averages reinforcing the current upward momentum.
Consequently, there exists a potential for further record highs, commencing at 2170. It is crucial to note that breaching and consolidating above this level would significantly bolster the strength of the upward trend, paving the way for targets at 2184 and 2200.
Conversely, a reversal below the previously breached resistance-turned-support levels at 2144 and, more notably, 2132, could temporarily halt the upward trajectory, leading to a bearish bias aiming for a retest of 2108 and 2095.
We caution that the risk level remains elevated, with all scenarios remaining plausible.
Furthermore, today’s trading environment is influenced by high-impact economic data releases from both the Eurozone and the United States, including the Eurozone’s interest rate and monetary policy statement from the European Central Bank, as well as the press conference by the ECB. Additionally, we await the testimony of the Chairman of the Federal Reserve from the United States, which may prompt significant price fluctuations upon release.
Moreover, amidst ongoing geopolitical tensions, the risk of heightened price volatility persists. It’s imperative to exercise caution in such a volatile environment.
Note: Trading on CFDs involves risks. Therefore, all scenarios may be possible. This article is not a recommendation to buy or sell but rather an explanatory reading of the price movement on the chart
| S1: |