
Gold prices have sustained their impressive rally into the second consecutive week, reaching a pinnacle during the initial trading sessions of this week at $2,189 per ounce, marking a new record high.
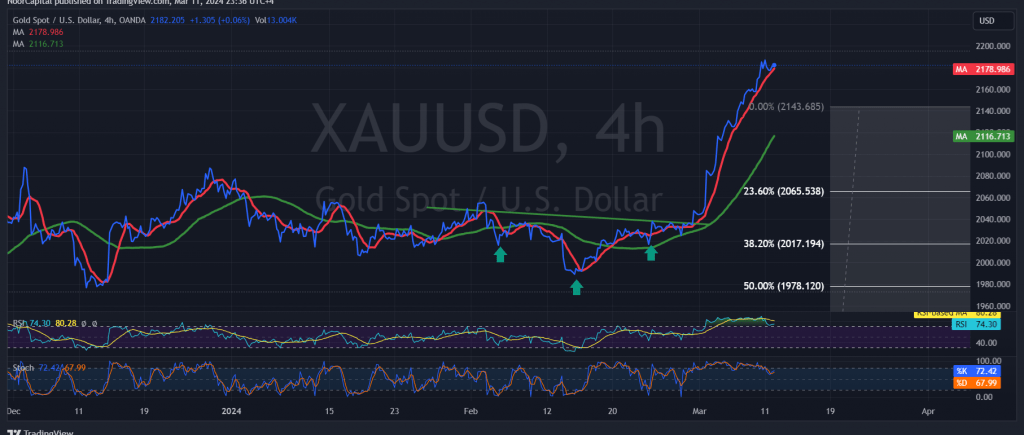
Today’s technical analysis, focusing on the 4-hour timeframe chart, reveals that the simple moving averages remain supportive of the ongoing upward trajectory of prices. Additionally, the Stochastic indicator indicates prolonged concentration around overbought levels.
With trading stability observed above the previously breached resistance level, which has now transitioned into a supportive role at 2145, the bullish trend retains its validity and efficacy. The primary target is set at 2200, with a successful breach serving as a catalyst for gold prices to embark on a further ascent towards 2218 and 2240 initially.
Conversely, a break below the aforementioned transformed support level at 2144 would delay the upward momentum, potentially prompting a minor corrective decline towards 2218 before resuming upward movement.
It’s important to note the elevated risk level inherent in the current market conditions, with all scenarios remaining plausible.
Additionally, caution is warranted today due to the impending release of high-impact economic data from both the United States and the United Kingdom, encompassing core consumer prices on a monthly and annual basis (excluding food and energy), as well as monthly and annual consumer prices. Furthermore, attention should be directed towards the UK’s index of change in unemployment benefits. These data releases may trigger significant price volatility upon their announcement.
the persisting geopolitical tensions further contribute to the heightened level of risk, potentially amplifying price volatility in the market.
Note: Trading on CFDs involves risks. Therefore, all scenarios may be possible. This article is not a recommendation to buy or sell but rather an explanatory reading of the price movement on the chart
| S1: |