
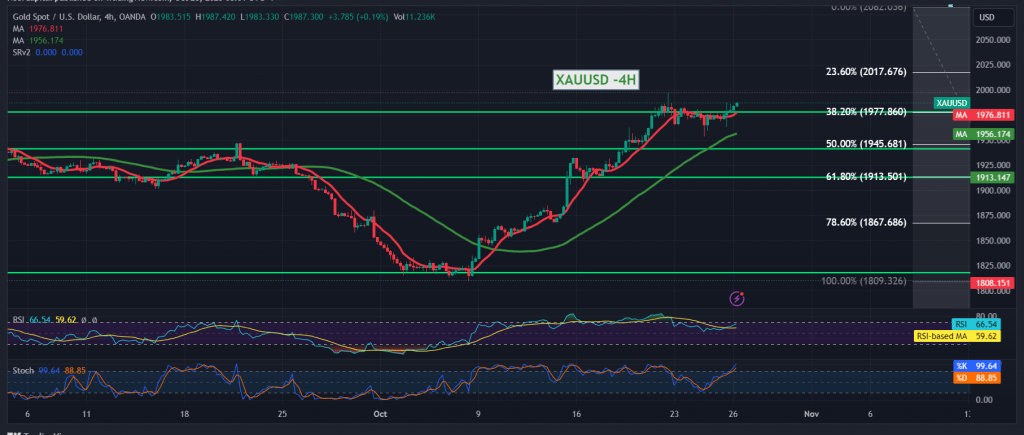
Positive trading dominated gold price movements yesterday, in line with the positive outlook expected in the previous technical report. In this report, we relied on the ability of the gold price to consolidate above 1977, heading towards the first official target of 1980. The metal recorded its highest level during early trading of the current session, at $1987 per ounce.
Technically, the price clearly breached the 1977 resistance level, represented by the 38.20% Fibonacci retracement, as shown on the 4-hour time frame chart. The simple moving averages continue to provide a positive incentive.
Therefore, the bullish scenario remains valid and effective, complementing the other objectives of the previous analysis, 1994, the next target, and then 2002, knowing that rising and penetrating the aforementioned level increases and accelerates the strength of the upward trend, opening the way towards 2017, an official target.
As a reminder, closing at least an hour before 1969 puts the gold price under negative pressure with the target of 1958, and breaking the latter forces the price to visit 1945/1947.
Note: Today we are awaiting high-impact economic data issued by the Eurozone (European Central Bank Monetary Policy Committee statement, European Central Bank press conference, interest rates on the euro)
In the US, (preliminary estimates of gross domestic product).
Note: Trading on CFDs involves risks. Therefore, all scenarios may be possible. This article is not a recommendation to buy or sell but rather an explanatory reading of the price movement on the chart.
| S1: |