
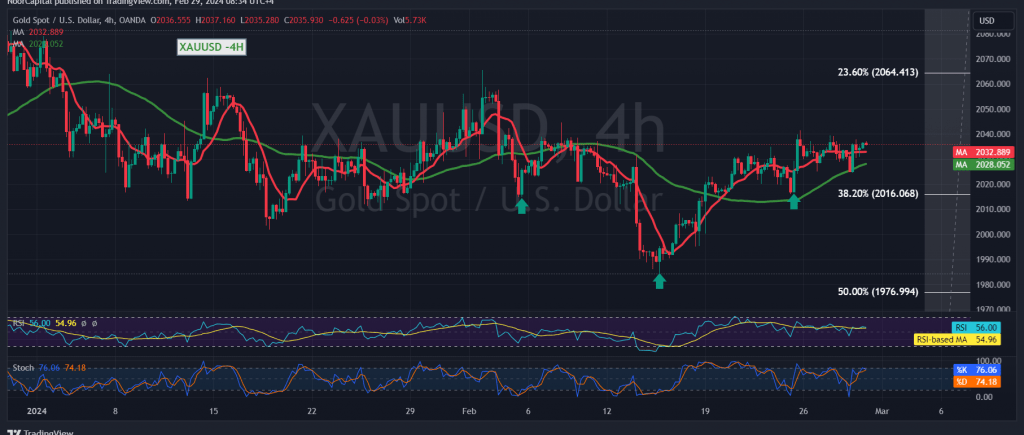
The support level highlighted in the previous technical report, situated at $2025, effectively bolstered the positive stability of gold prices. After successfully retesting this level, with a peak at $2024, gold prices experienced an upward rebound, currently trading near their highest point during the early session, at $2037 per ounce.
Today’s technical analysis, scrutinizing the 4-hour timeframe chart, indicates that gold prices remain steadfast above the primary support corresponding to the 38.20% Fibonacci retracement level for the 2016 trading period. Furthermore, the simple moving averages continue to provide support, contributing to the sustained upward trajectory of prices.
As long as the price maintains intraday stability above $2025, along with overall positive stability above the aforementioned Fibonacci retracement level, the upward trend retains its validity and efficacy. Notably, consolidating above $2035 serves as a catalyst, increasing the likelihood of a rise towards $2042 and $2055, respectively, with further gains potentially extending towards $2065, marking the official target for the current upward wave.
It is crucial to emphasize that a failure to sustain positive stability above $2016 may initiate initial negative pressure, with targets set at $2000 and $1995. In the event of a corrective decline, the official target stands at $1977.
A word of caution: Today’s trading activity may witness heightened volatility due to the impending release of high-impact economic data from the American economy, including the annual and monthly basic personal consumption spending prices, alongside the weekly unemployment benefits. Furthermore, the prevailing geopolitical tensions elevate the risk level, potentially contributing to increased price volatility.
Note: Trading on CFDs involves risks. Therefore, all scenarios may be possible. This article is not a recommendation to buy or sell but rather an explanatory reading of the price movement on the chart
| S1: |