
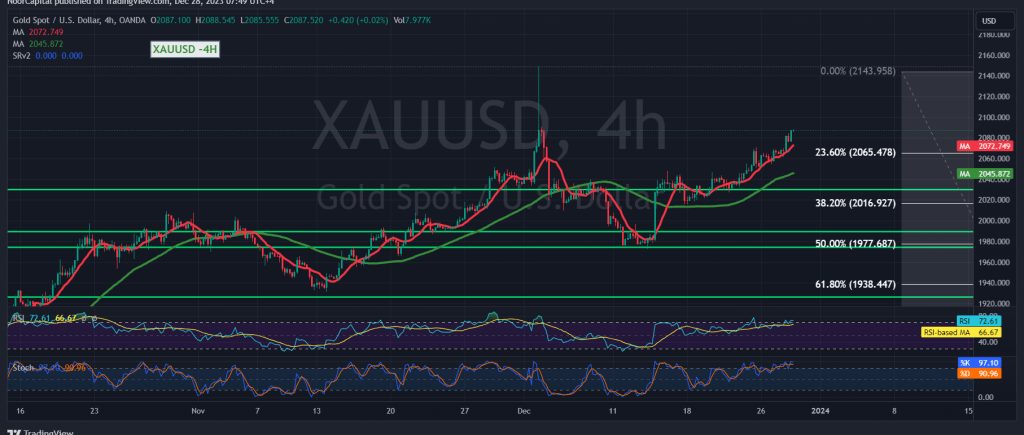
Gold prices maintained the expected upward trend during the previous technical report, continuing to build a rising wave, exceeding yesterday’s official target station of 2078, recording its highest level of $2088 during early trading in today’s session.
From the angle of technical analysis today, and with a closer look at the 4-hour chart, we find that the simple moving averages support the upward daily curve for prices, and are stimulated by the clear positive signals on the Relative Strength Index on short time frames.
From here, with the stability of the intraday trading above 2070, and in general above the previously breached resistance that was transformed into a support level according to the concept of exchanging roles, 2065, the 23.60% correction, the bullish scenario remains valid and effective, targeting 2096, the first target, and breaching it increases and accelerates the strength of the upward trend, opening the way directly towards 2105 initially. .
We remind you that closing the hourly candle at least below 2065 puts the price under temporary negative pressure, and there may be an opportunity to retest the support levels of 2051 and 2045 before attempts to rise again.
Warning: Risk level is high.
Warning: The level of risk is high amid continuing geopolitical tensions, and we may witness high price volatility.
Note: Trading on CFDs involves risks. Therefore, all scenarios may be possible. This article is not a recommendation to buy or sell but rather an explanatory reading of the price movement on the chart.
| S1: |