
Gold prices experienced significant losses yesterday, aligning with the downward corrective trend identified in the previous technical report. The price reached the forecasted target of $2375, recording its lowest level at $2366 per ounce.
Examining the 4-hour time frame chart, several key technical indicators suggest the continuation of a downward trend:
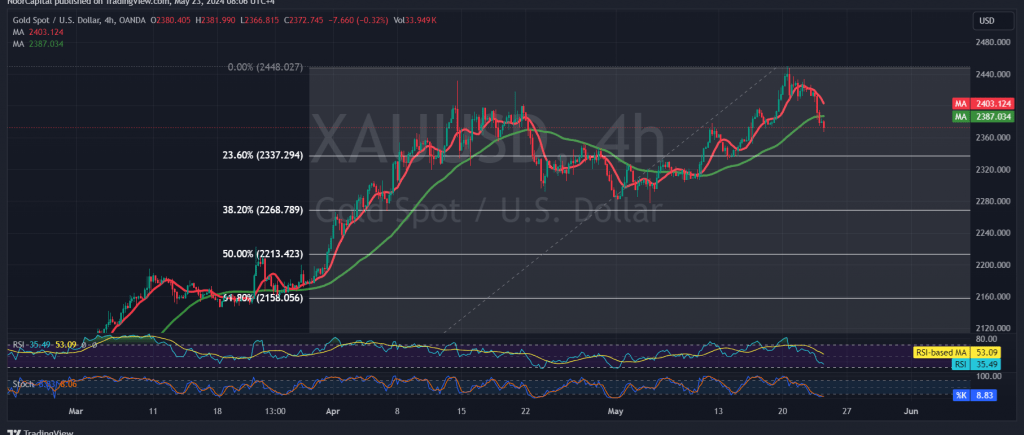
- Simple Moving Averages (SMA): The SMAs are exerting negative pressure on gold prices from above, indicating a bearish market sentiment.
- Momentum Indicator: The 14-day momentum indicator remains below the midline of 50, reinforcing the bearish outlook.
Given these indicators, the possibility of continued corrective decline is high. The next targets are set at:
- 2349: The immediate support level.
- 2337: Corresponding to the 23.60% Fibonacci retracement level.
Upside Potential: For the bearish scenario to be invalidated, gold prices need to break above:
- 2395: A key resistance level.
- 2400: A critical psychological threshold. Should these levels be surpassed and sustained, gold prices may resume an upward trajectory towards:
- 2410
- 2430
Economic Data and Market Volatility: Today’s market may experience high volatility due to the release of significant economic data from major economies, including:
- France and Germany: Preliminary readings of the Services and Manufacturing PMI indices.
- United Kingdom: Preliminary reading of the Services and Manufacturing PMI indices.
- United States: Preliminary reading of the Services and Manufacturing PMI indices.
Geopolitical Risks: High geopolitical tensions continue to pose a significant risk, potentially leading to substantial price fluctuations.
| S1: |