
The British pound reversed the expected bearish trend during the previous technical report, in which we relied on trading remaining below the resistance level of 1.2075, affected by the news issued by the British economy.
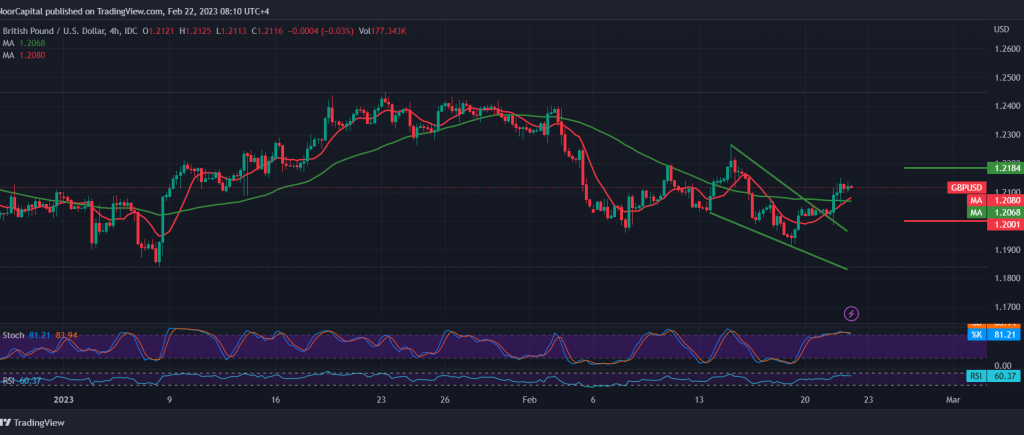
On the technical side today, and by looking at the 240-minute chart, we notice the return of the simple moving averages to hold the price from below and provide a positive motive, stimulated by the positive signals coming from the RSI stable above the mid-line 50, on the other hand, we find the stochastic indicator around the overbought areas.
Although we tend to be positive, there is a possibility of a bearish bias in the coming hours, to retest 1.2020 before continuing the rise again, noting that retesting does not contradict the bullish trend, whose initial targets are around 1.2180 once 1.2140 is breached.
Note: Today we are awaiting the “results of the Federal Reserve Committee meeting” and may witness high price fluctuations.
Note: Trading on CFDs involves risks. Therefore, all scenarios may be possible. This article is not a recommendation to buy or sell but rather an explanatory reading of the price movement on the chart.
| S1: |