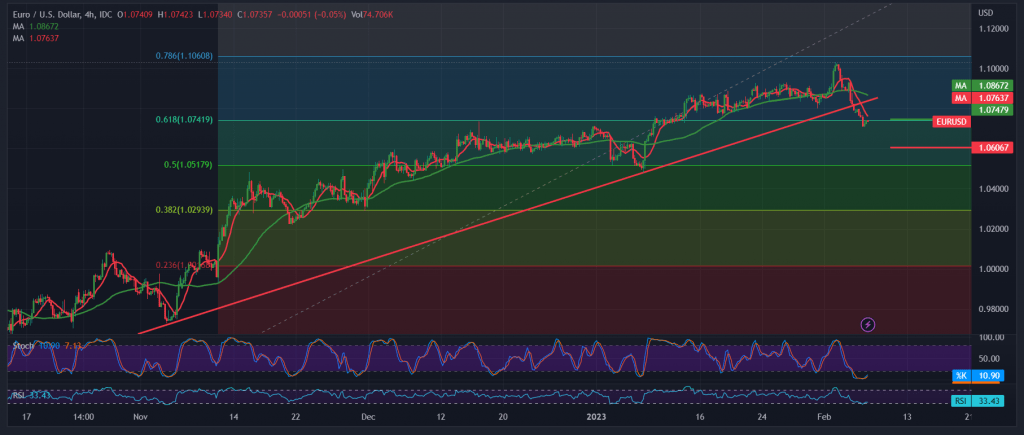
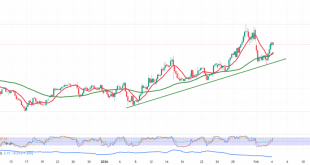
Negative trades dominated the movements of the euro-dollar during the first trading sessions of this week, within the expected negative outlook during the previous analysis, touching the official target station 1.0740, recording its lowest level at 1.0709.
On the technical side today, by looking at the 240-minute chart, we find that the pair is now hovering around 1.0704, represented by a Fibonacci correction of 61.80%, as shown on the chart. With careful consideration, we find that the simple moving averages continue the negative pressure on the price from above, in addition to a decline. The visible momentum is on the 14-day momentum indicator.
From here, with trading steadily below the resistance level of the psychological barrier of 1.0800, the bearish daily trend remains the most preferred, taking into consideration that the decline below the support floor of 1.0700 facilitates the task required to visit 1.0660 as the next target, and may extend later to visit 1.0630.
The price’s consolidation above 1.0800 leads the pair to recover part of its losses, targeting a retest of 1.0840 & 1.0870.
Note: Stochastic is around oversold areas, and we may witness some fluctuation until we get the official trend mentioned above.
Note: Today we are waiting for the speech of the “Chairman of the Federal Reserve”, which has a significant impact, and we may witness fluctuations in prices during the issuance of the speech.
Note: Trading on CFDs involves risks. Therefore, all scenarios may be possible. This article is not a recommendation to buy or sell but rather an explanatory reading of the price movement on the chart.
| S1: 1.0700 | R1: 1.0790 |
| S2: 1.0660 | R2: 1.0840 |
| S3: 1.0610 | R3: 1.0880 |
 Noor Trends News, Technical Analysis, Educational Tools and Recommendations

