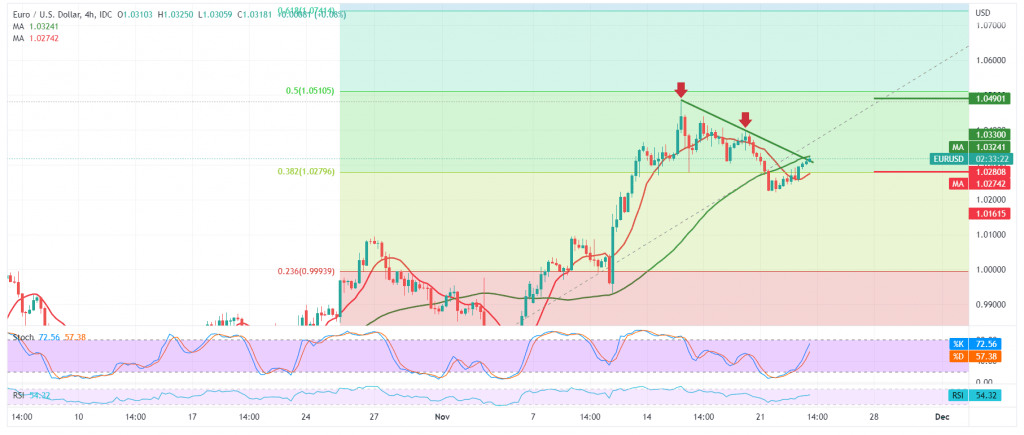
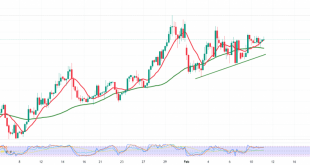
A downward trend dominated the movements of the Euro-dollar pair during the previous trading session within the expected downward track mentioned in the last report, approaching by a few points by the first target 1.0210, to suffice for recording its lowest level at 1.0222.
Technically, and with a closer look at the 240-minute chart, we notice the return of the euro’s stability above the 1.0270 support level, represented by Fibonacci correction 38.20%, accompanied by positive crossover signs that started to appear on the stochastic, and on the other hand, the simple moving average is still 50 A day that constitutes an obstacle in front of the pair. Moreover, it meets around the resistance level of 1.0330, adding more strength.
With conflicting technical signals, we prefer to monitor the price movement of the pair to be facing one of the following scenarios:
To resume the drop that occurred yesterday, we need to see the price consolidating below 1.0270, which will facilitate the task required to visit 1.0210 as a first target. The negative targets may extend later to visit 1.0170.
To get an upside trend, we need to see the price consolidating above the extended resistance 1.0350/1.0330, which might be a catalyst that enhances the chances of rising towards 1.0385 and 1.0435, respectively.
Note: We are awaiting high-impact economic data in the US, “the preliminary reading of the services and manufacturing PMI and Federal Reserve Committee meeting.”
Note: Trading on CFDs involves risks. Therefore, all scenarios may be possible. This article is not a recommendation to buy or sell but rather an explanatory reading of the price movement on the chart.
| S1: 1.0270 | R1: 1.0350 |
| S2: 1.0210 | R2: 1.0385 |
| S3: 1.0170 | R3: 1.0435 |
 Noor Trends News, Technical Analysis, Educational Tools and Recommendations

