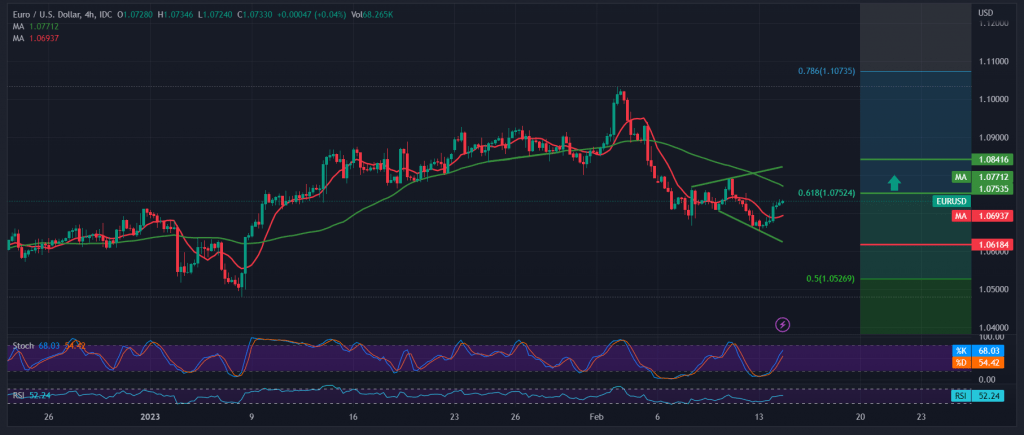
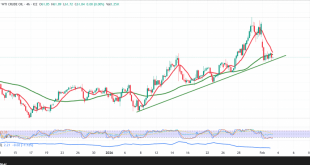
The single European currency started its daily trading on an upward rebound, taking advantage of the support floor posted last Friday at 1.0655, which forced the price to form an upward bias. As a result, the pair now hovers around its highest level during the early trading of the current session at 1.0732.
On the technical side, the pair is close to retesting the previously broken support at 1.745, which turned into resistance, represented by Fibonacci correction 61.80%, which constitutes one of the essential directional keys for today’s session. However, we find the 50-day simple moving average still constitutes a continuous obstacle in pressing the price from above. On the other hand, Stochastic started to provide positive crossover signals.
From the conflicting technical signals and the approach of the EUR/USD pair to pivotal levels, we prefer to monitor the price behavior of the pair to be facing one of the following scenarios:
The price consolidation of the 60-minute candle above the resistance of 1.0745 can consolidate the gains towards 1.0780 and then 1.0840 as a second target.
Resuming the downside track requires us to witness stability below 1.0745, targeting 1.0675. It should be noted that confirming the breach of 1.0675 facilitates the drop towards the official target of the descending wave of 1.0620.
Note: Markets are awaiting high-impact data issued by the US economy, “US inflation data/consumer price index”, and we may witness high price fluctuations at the release.
Note: Trading on CFDs involves risks. Therefore, all scenarios may be possible. This article is not a recommendation to buy or sell but rather an explanatory reading of the price movement on the chart.
| S1: 1.0675 | R1: 1.0780 |
| S2: 1.0620 | R2: 1.0840 |
| S3: 1.0575 | R3: 1.0880 |
 Noor Trends News, Technical Analysis, Educational Tools and Recommendations

