
Positive Momentum in EUR/USD:
The EUR/USD pair experienced an upward trend in the previous trading session, largely attributed to a slight decline in the US dollar index following the release of US retail data. This movement reflects shifting dynamics in currency markets as investors react to economic indicators.
Technical Analysis Insights:
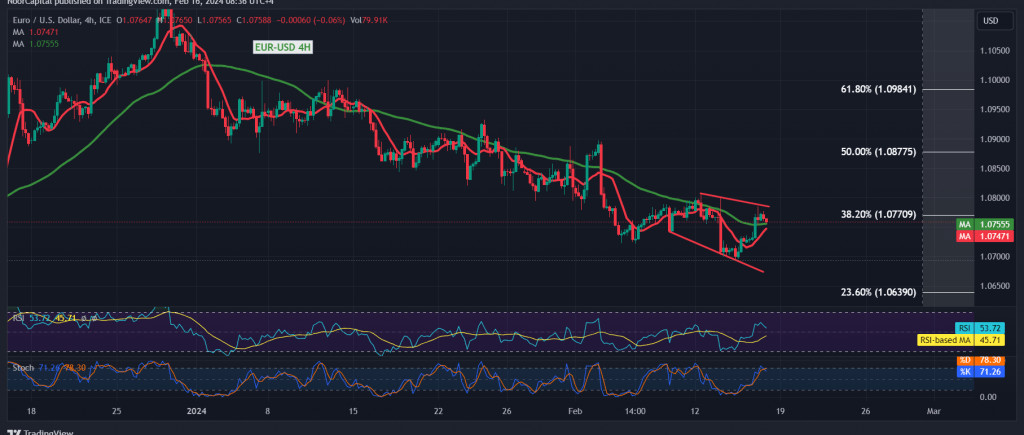
On the technical front, the pair is seen retesting the resistance level identified in the previous technical report, positioned at 1.0775. However, it has been unable to breach this level thus far. Signs of negativity are emerging on the Stochastic indicator, suggesting a potential downside. Conversely, the 50-day simple moving average is exerting upward pressure on the price.
Potential Scenarios:
Given the conflicting technical signals, traders are advised to closely monitor the pair’s price behavior, which could unfold in one of the following scenarios:
- Negative Pressure Scenario: If the pair stabilizes below 1.0720, it could face further downside pressure, targeting levels around 1.0675 and 1.0645.
- Positive Breakout Scenario: Conversely, a decisive break and consolidation above the pivotal resistance at 1.0775 would signal upward momentum, potentially leading to targets around 1.0835 and 1.0870, corresponding to the 50.0% Fibonacci retracement level.
Economic Data Watch:
Market participants are advised to remain vigilant as high-impact economic data is expected from both the British and US economies. Key releases include US monthly retail sales, annual core producer prices, monthly core producer prices, and the initial reading of the consumer confidence index issued by Michigan. Anticipate potential price fluctuations in response to these data releases.
Conclusion:
The EUR/USD pair’s recent movements underscore the importance of staying attuned to both technical signals and fundamental factors. Traders should exercise caution and adapt their strategies accordingly based on evolving market dynamics and incoming economic data.
Note: Trading on CFDs involves risks. Therefore, all scenarios may be possible. This article is not a recommendation to buy or sell but rather an explanatory reading of the price movement on the chart.
| S1: |