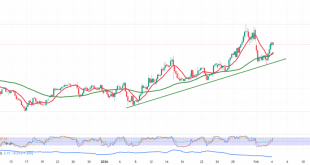
We committed to the intraday neutrality during the previous analysis due to the conflicting technical signals.
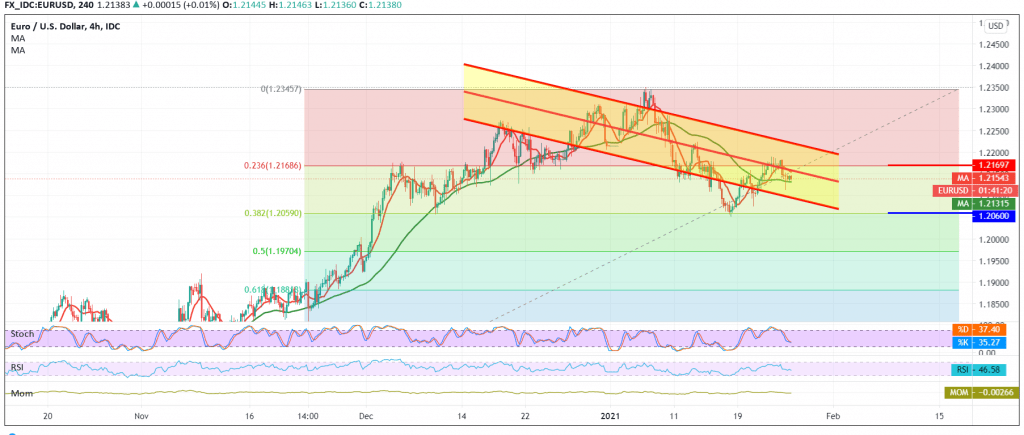
Technically, and with a closer look at the 240-minute chart, we find the negative pressure coming from the 50-day moving average, and we find that the RSI indicator began to gain bearish momentum on short time frames, in addition to trading stability below the resistance level of 1.2175 represented by the correction Fibonacci 23.60%.
We tend to the negativity, but we prefer to confirm a break of 1.2120, which will facilitate the task required to visit 1.2065, the first target represented by the Fibonacci retracement of 38.20% and may extend later towards 1.2040 / 1.2030.
A reminder that surpassing the ascending resistance level at 1.2175 delays the chances of a reversal, but does not cancel them, and we may witness a bullish slope aimed at re-testing 1.2210.
| S1: 1.2110 | R1: 1.2175 |
| S2: 1.2065 | R2: 1.2210 |
| S3: 1.2040 | R3: 1.2250 |
 Noor Trends News, Technical Analysis, Educational Tools and Recommendations

