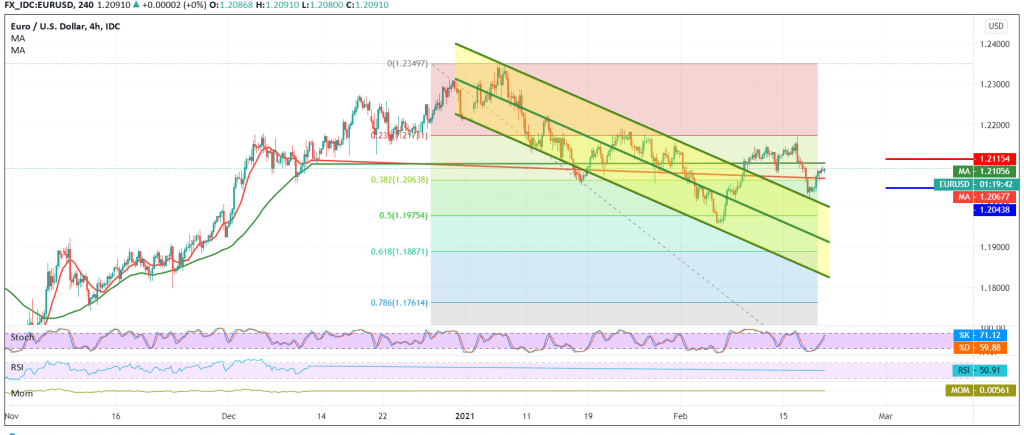
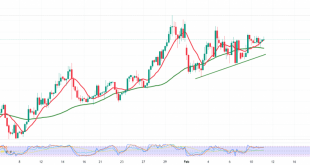
The Euro found a solid support floor near the last official target to be achieved, located at 1.2020, which push it to bounce back up to restore the resistance level mentioned in the previous analysis at 1.2090.
Technically speaking, and by looking at the 240-minute chart, we find the pair is trying to build on support floor above the 1.2065 level represented by the 38.20% Fibonacci =as shown on the chart, and we find that the RSI indicator continues to send positive signals.
On the other hand, trading stabilized below the resistance level at 1.2110, in addition to the emergence of negative signs on Stochastic. This contradiction makes us stand on the fence until the next price movement becomes clear, so that we will be in front of one of the following scenarios:
To re-activate long positions, we need stability above 1.2065 / 1.2050. We also need to witness a clear breach of 1.2115 in order to open the way towards 1.2175, a 23.60% correction.
Reactivating short positions again requires a break of 1.2050, which renews the chances of a return to the bearish trend with the first goal of 1.2010 and 1.2175, respectively.
| S1: 1.2050 | R1: 1.2115 |
| S2: 1.2010 | R2: 1.2140 |
| S3: 1.1975 | R3: 1.2175 |
 Noor Trends News, Technical Analysis, Educational Tools and Recommendations

