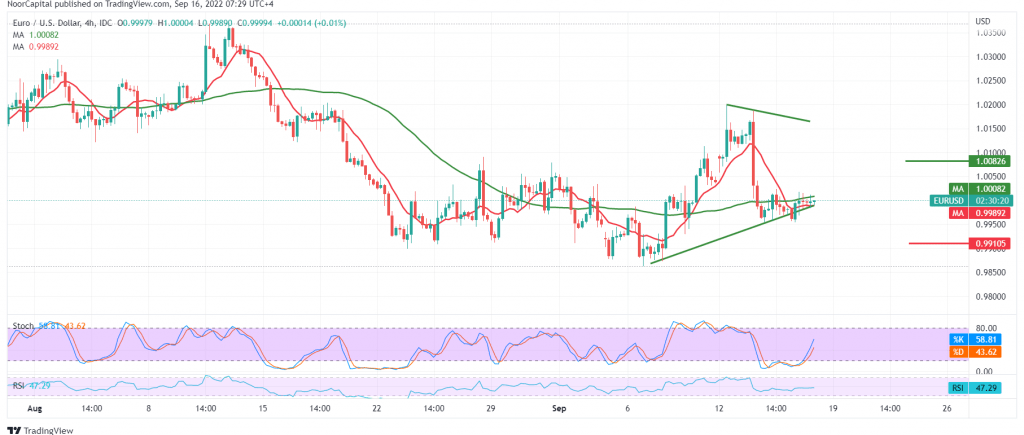
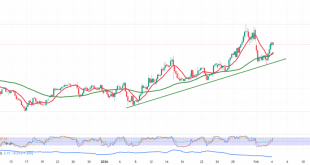
Limited sideways trading dominated the EUR/USD pair’s movements during the previous trading session, to find that the movements were restricted between 0.9960 and 1.0000.
From the technical analysis angle, and by looking at the 4-hour chart, we find positive crossover signs that started appearing on the stochastic indicator, in addition to the intraday cohesion above 0.9950/0.9960, which supports the possibility of a rise. On the other hand, the 50-day simple moving average still constitutes an obstacle in front of the pair. It meets near the resistance of the psychological barrier 1.0000, which supports the possibility of the return of the official bearish path.
With the conflicting technical signals, we prefer to monitor the price behavior of the pair to be in front of one of the following scenarios:
The decline below 0.9950, we may witness the domination of the official bearish trend again to visit the bottom of 0.9910, and we should pay close attention to this level due to its importance to the general trend in the short term, and breaking it would extend losses towards 0.9875 initially.
To complete the bullish correction attempts, we need to witness a clear and strong breach of the resistance level 1.0000 and most importantly, 1.0015; this is a catalyst factor that may enhance the chances of touching 1.0050, and the bullish correction may extend towards 1.0080 initially.
Note: Stochastic is still giving negative signals.
Note: Trading on CFDs involves risks. Therefore, all scenarios may be possible. This article is not a recommendation to buy or sell but rather an explanatory reading of the price movement on the chart.
| S1: 0.9960 | R1: 1.0015 |
| S2: 0.9910 | R2: 1.0055 |
| S3: 0.9875 | R3: 1.0085 |
 Noor Trends News, Technical Analysis, Educational Tools and Recommendations

