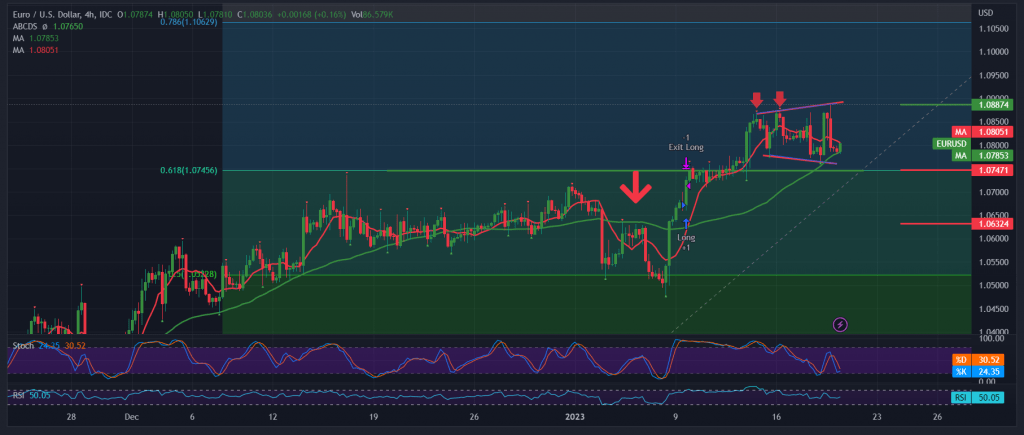
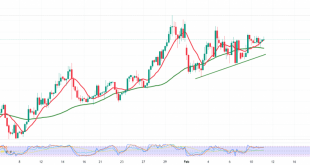
The single European currency achieved our expected bullish target during the previous session’s trading, which was at 1.0870 and recorded its highest level at 1.0887.
Technically, we notice that the level of 1.0880 formed strong resistance on the EUR/USD pair and forced it to decline marginally to the downside so that the pair is now hovering around 1.0800; with a closer look at the 240-minute time chart, we notice the beginning of a decline in the bullish momentum and the clear negative signs accompany it on the stochastic indicator, which indicates to a possible gradual decline.
Despite the negative factors, the bearish trend will only be achieved by a clear and strong breach of the strong support floor 1.0745, represented by Fibonacci 61.80%, as shown on the chart, noting that breaking it signals the beginning of a decline, its first target 1.0700, and extends to 1.0640 later.
Note: If the simple moving average continues to provide a positive impulse, and the pair consolidates again above 1.0880, then the target will be 1.0940.
Note: Trading on CFDs involves risks. Therefore, all scenarios may be possible. This article is not a recommendation to buy or sell but rather an explanatory reading of the price movement on the chart.
Note: Trading on CFDs involves risks. Therefore, all scenarios may be possible. This article is not a recommendation to buy or sell but rather an explanatory reading of the price movement on the chart.
| S1: 1.0745 | R1: 1.0865 |
| S2: 1.0695 | R2: 1.0940 |
| S3: 1.0625 | R3: 1.0985 |
 Noor Trends News, Technical Analysis, Educational Tools and Recommendations

