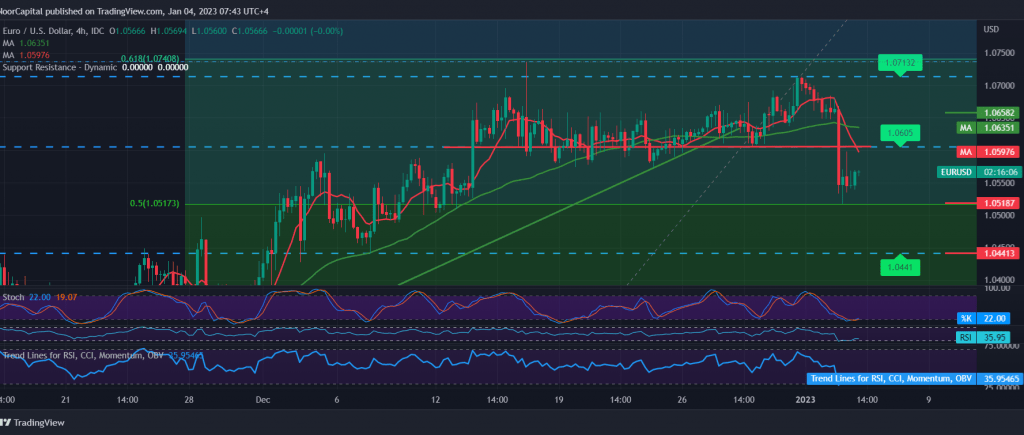
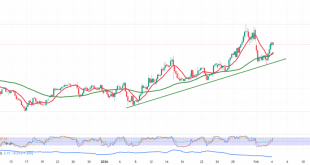
The movements of the EUR/USD pair witnessed a negative trading session, negating the expected bullish scenario in the previous analysis. We have indicated that a decline below 1.0590/1.0600 can nullify the suggested bullish scenario and place the pair under intense negative pressure, aiming to retest 1.0560 & 1.0510, recording its lowest level at 1.0519.
Technically, and by looking at the 4-hour chart, we find that the euro managed to break the support level of 1.0600, accompanied by the negative pressure coming from the simple moving averages, which supports the continuation of the decline that started yesterday and stimulates the bearish scenario, the clear negative signs on the momentum indicator, on the other hand, we find that the stochastic started to send positive crossover signals, as the pair entered an oversold phase.
With conflicting technical signals, we prefer to monitor the price behaviour to be in front of one of the following scenarios:
Confirmation of the breach of 1.0520, Fibonacci correction of 50.0%, as a sign of the trend turning into a bearish path, with targets starting at 1.0430 and extending towards 1.0335 initially.
Rising again above the previously broken support of 1.0640/1.0660 could lead to a resume of the bullish path, with the first target of 1.0740, the 61.80% correction, and then 1.0820.
Note: The minutes of the Fed’s latest policy meeting are set to come out in the afternoon, and we may witness high price volatility.
Note: Trading on CFDs involves risks. Therefore, all scenarios may be possible. This article is not a recommendation to buy or sell but rather an explanatory reading of the price movement on the chart.
| S1: 1.0495 | R1: 1.0660 |
| S2: 1.0430 | R2: 1.0740 |
| S3: 1.0335 | R3: 1.0820 |
 Noor Trends News, Technical Analysis, Educational Tools and Recommendations

