
The EUR/USD pair experienced minimal fluctuations yesterday in the absence of US markets, as it made quiet attempts to achieve modest gains.
Technical Analysis Highlights Euro’s Efforts to Break Resistance
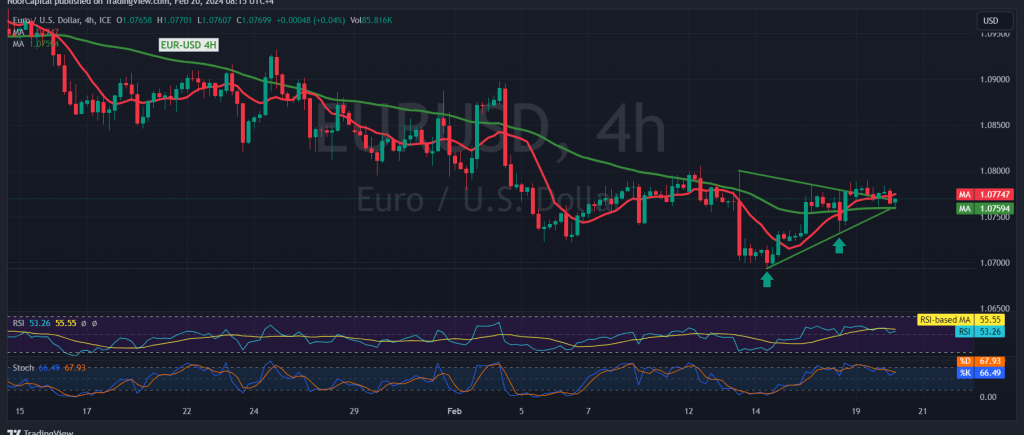
Today’s technical analysis reveals the euro’s endeavor to surpass the formidable resistance level situated at 1.0765, a crucial determinant of the pair’s trend. A closer examination of the 4-hour time frame chart indicates the pair’s efforts to stabilize above the 50-day simple moving average, signaling potential upward movement. Additionally, the Stochastic indicator is showing signs of shedding current negative signals.
Cautious Optimism Amidst Potential Upside Movement
While there’s a tendency for upward movement, caution is warranted. This sentiment is grounded in the necessity for daily trading to remain stable above 1.0710. A rise above and consolidation beyond 1.0765 would serve as a significant catalyst for the pair to initiate an upward trajectory in the immediate term. Initial targets for this potential upward wave stand at 1.0860, with the possibility of extending gains towards 1.0960 in the longer run.
Bearish Scenario in Case of Support Breakdown
Conversely, a return to stability below the aforementioned support level of 1.0710 would halt upward attempts and guide the pair towards a bearish trajectory, targeting 1.0640.
The EUR/USD pair navigates a nuanced landscape, with technical indicators hinting at potential upward movement. However, caution remains paramount, with stability above key support levels crucial for sustaining any bullish momentum. Conversely, a breakdown in support could usher in bearish sentiment, emphasizing the importance of closely monitoring key levels for trading decisions.
Note: Trading on CFDs involves risks. Therefore, all scenarios may be possible. This article is not a recommendation to buy or sell but rather an explanatory reading of the price movement on the chart.
| S1: |