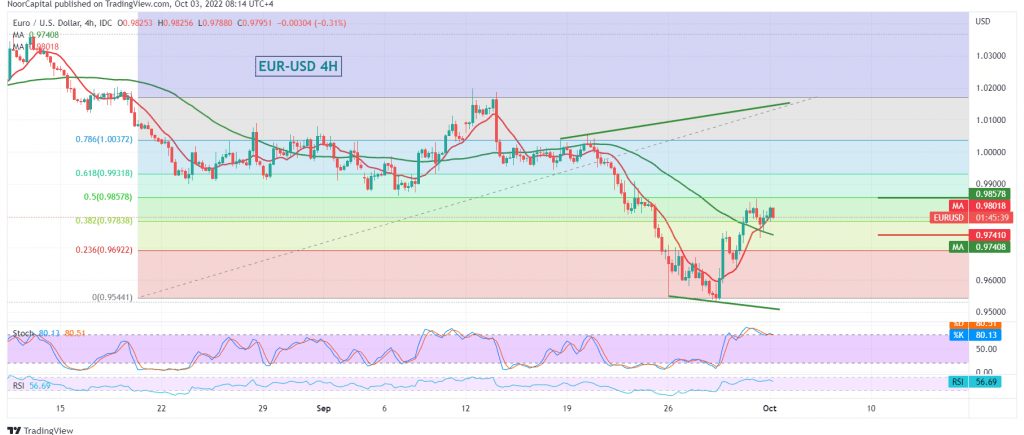
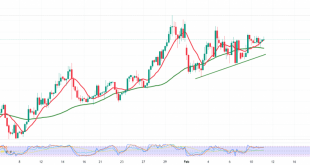
Positive trades dominate the euro’s movements against the US dollar, trying to build on intraday stability above the support level of 0.9780, recording the highest level at 0.9853 at the end of last week’s trading.
Technically, and with a careful look at the chart, an interval of 240 minutes, we find the 50-day simple moving average trying to push the price higher and meet near the 0.9740 support level and add more strength to it; this comes in conjunction with the attempts of the 14-day momentum indicator to obtain signals positively.
Despite the technical factors that indicate the possibility of a bullish bias, we need to witness intraday stability above 0.9780 and, in general, above 0.9740. Furthermore, we must witness a clear and strong breach of the 0.9855 resistance level, 50.0% Fibonacci correction, which motivates the pair to visit 0.9915/0.9910 as a first target. The bullish correction wave extends to visit 0.9980 later.
The decline below 0.9740 will immediately stop the attempts to rise and lead the pair to the official descending path, targeting 0.9675, the next awaited station.
Note: Trading on CFDs involves risks. Therefore, all scenarios may be possible. This article is not a recommendation to buy or sell but rather an explanatory reading of the price movement on the chart.
| S1: 0.9740 | R1: 0.9855 |
| S2: 0.9675 | R2: 0.9915 |
| S3: 0.9610 | R3: 0.9980 |
 Noor Trends News, Technical Analysis, Educational Tools and Recommendations

