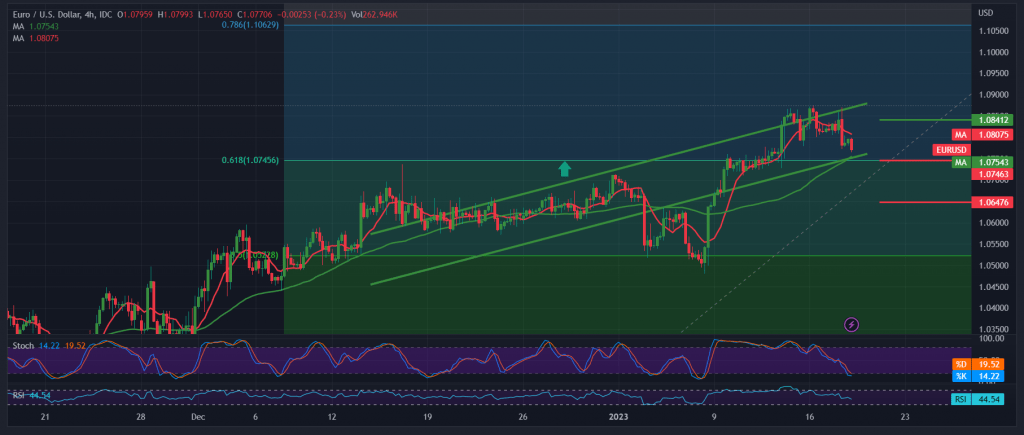
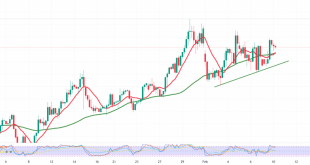
The EUR/USD pair achieved the first bullish target at 1.0870, recording its highest level at 1.0870, to hit a strong resistance level that forced it to trade in negativity.
Technically, the resistance levels at 1.0870 constituted an obstacle in front of the pair. However, the current movements are witnessing stability around its lowest level during the early trading of the current session 1.0773. With a close look at the 4-hour chart, we find the 50-day simple moving average continues to hold the price from below and converges around near From the support level of 1.0745 represented by 61.80% Fibonacci correction, adding more strength to it, in addition to the stochastic approaching the oversold areas.
With trading stabilizing above 1.0745, the bullish scenario remains valid and effective, targeting 1.0840 first and then 1.0870, considering that the price’s consolidation above 1.0870 can enhance the chances of rising towards 1.0900.
The decline below 1.0745, Fibonacci correction 61.80%, can reverse the bullish trend, and the pair begins a corrective decline, with targets starting at 1.0700 and extending to 1.0650.
Note: High-impact data are due today, UK Annual Consumer Prices, US Retail Sales and US Producer Prices and may cause some volatility.
Note: Trading on CFDs involves risks. Therefore, all scenarios may be possible. This article is not a recommendation to buy or sell but rather an explanatory reading of the price movement on the chart.
| S1: 1.0740 | R1: 1.0840 |
| S2: 1.0700 | R2: 1.0900 |
| S3: 1.0645 | R3: 1.0940 |
 Noor Trends News, Technical Analysis, Educational Tools and Recommendations

