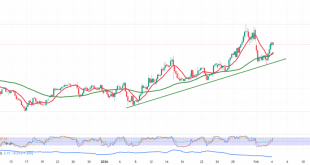
The single European currency achieved all our bullish targets during the previous report, reaching the final target at 1.0465 and recording its highest level at 1.0480.
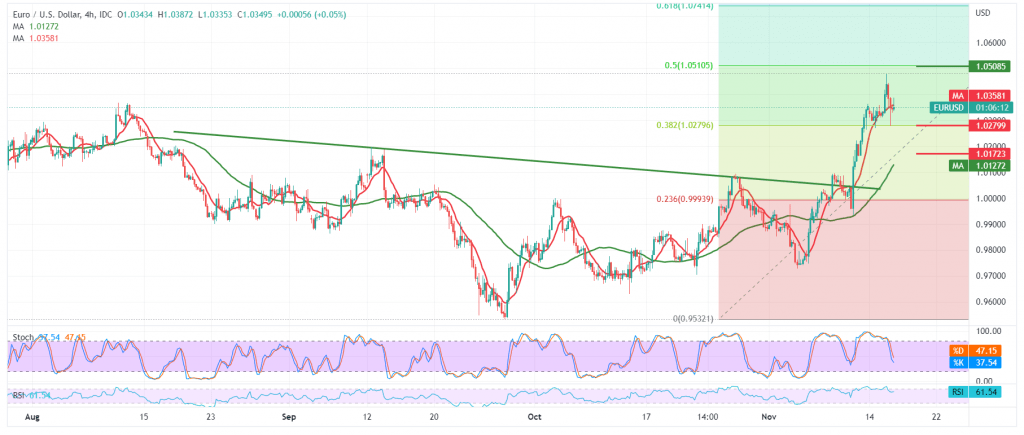
On the technical side, the pair found a strong resistance level around the level published yesterday 1.0465, which forced it to retreat to the downside, within the idea of retesting the pivotal support floor 1.0280, which it is trying to settle above. by closer look at the 4-hour chart, we find that the simple moving averages still hold price from below.
Therefore, the bullish bias is more likely during the day, targeting 1.0465 as a first target, and then 1.0520 Fibonacci 50.0%, as shown on the chart, as the next price station, unless we witness a trading level below 1.0270.
The decline below 1.0270 can thwart the bullish scenario completely and put the pair under negative pressure, aiming to retest 1.0170.
Note: Trading on CFDs involves risks. Therefore, all scenarios may be possible. This article is not a recommendation to buy or sell but rather an explanatory reading of the price movement on the chart.
| S1: 1.0270 | R1: 1.0465 |
| S2: 1.0170 | R2: 1.0570 |
| S3: 1.0060 | R3: 1.0665 |
 Noor Trends News, Technical Analysis, Educational Tools and Recommendations

