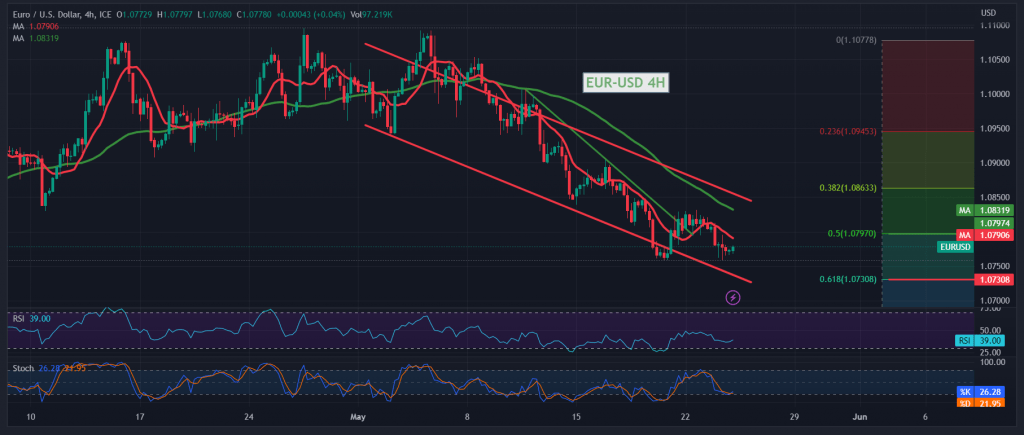
Narrow sideways trading tended to be negative, dominating the movements of the EUR/USD pair during the previous trading session after it failed to stabilize for a long time, according to the resistance of the psychological barrier 1.0800.
Technically, with a closer look at the 240-minute chart, we find the Euro stable below the 1.0790 resistance level represented by Fibonacci correction 50.0%, as shown on the chart, in addition to the negative pressure of the Simple Moving Averages that pressured the price from above, in addition to the regularity of move within the price channel. Downlink.
Therefore, the bearish slope is the most preferable during the day, targeting 1.0700/1.0720 as a first target, and breaking the mentioned level facilitates the task required to visit 1.0650, the next waiting station.
Only from above, it crossed upwards, and the price consolidated above 1.0790, the 50.0% correction, and an hourly candle closes above it, which may lead the pair to temporary recovery attempts, aiming to retest 1.0870/1.0850.
Note: Today we are awaiting highly sensitive economic data issued by the US economy, “the results of the Federal Reserve Committee meeting,” the speech of the US Treasury Secretary, and we are awaiting “inflation” data from the United Kingdom and the talk of the “Governor of the Bank of England,” in addition to the report issued by the International Energy Agency regarding Oil stocks, and we may witness high volatility in prices at the time of the news release.
Note: Trading on CFDs involves risks. Therefore, all scenarios may be possible. This article is not a recommendation to buy or sell but rather an explanatory reading of the price movement on the chart.
| S1: |
 Noor Trends News, Technical Analysis, Educational Tools and Recommendations

