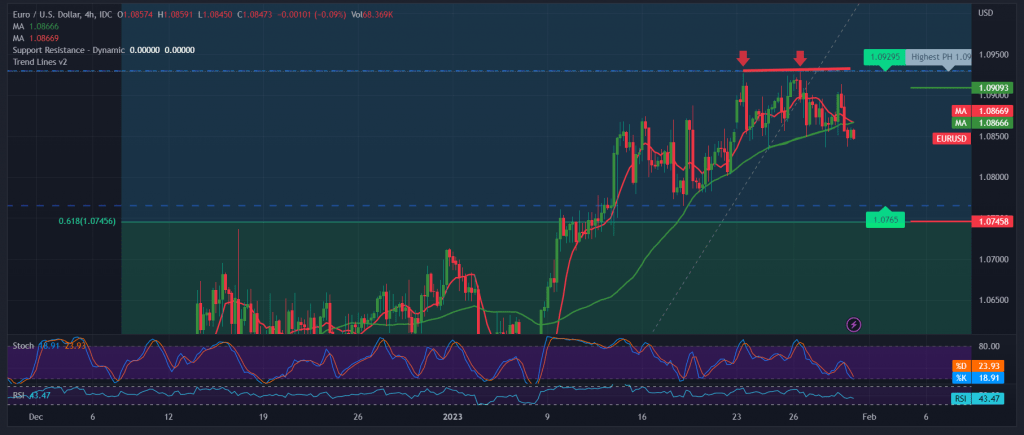
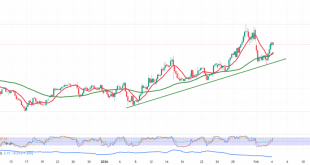
Quiet trades tended to be positive within the expected bullish track, for the EUR/USD pair to touch the first target achieved during the previous report at 1.090, recording its highest level at 1.0913.
Technically, the pair found a strong resistance level around the psychological barrier 1.0900, and failed to stabilize for a long time above it, to return to retest the pivotal support level 1.0830, explaining that this level represents the key to protecting the bullish trend, to start its daily trading by pressing on the level above, while carefully looking at the chart of 240-minute, we find the simple moving averages started to pressure the price from above, in addition to the negative signs coming from the 14-day momentum indicator, on the other hand, the stochastic indicator around the oversold areas.
With conflicting technical signals, we prefer to monitor the price behaviour to obtain a high-quality deal, to be in front of one of the following scenarios:
To get the beginning of a bearish correctional wave, we need to witness a clear and strong break of the support floor 1.0830, which opens the door directly to visit 1.0770 and 1.0745, Fibonacci 61.80%, as an official station.
The breach to the upside, and the return of trading stability above the resistance of the psychological barrier 1.0900, from here, let the pair recover, targeting 1.0940 & 1.0970, and the gains may extend later to visit 1.01030.
Note: Today we are awaiting high-impact data from the US economy, “Consumer Confidence Index,” and we may witness high volatility at the time of the news release.
Note: Trading on CFDs involves risks. Therefore, all scenarios may be possible. This article is not a recommendation to buy or sell but rather an explanatory reading of the price movement on the chart.
| S1: 1.0830 | R1: 1.0900 |
| S2: 1.0770 | R2: 1.0940 |
| S3: 1.0745 | R3: 1.0975 |
 Noor Trends News, Technical Analysis, Educational Tools and Recommendations

