Positive Momentum vs. Psychological Resistance
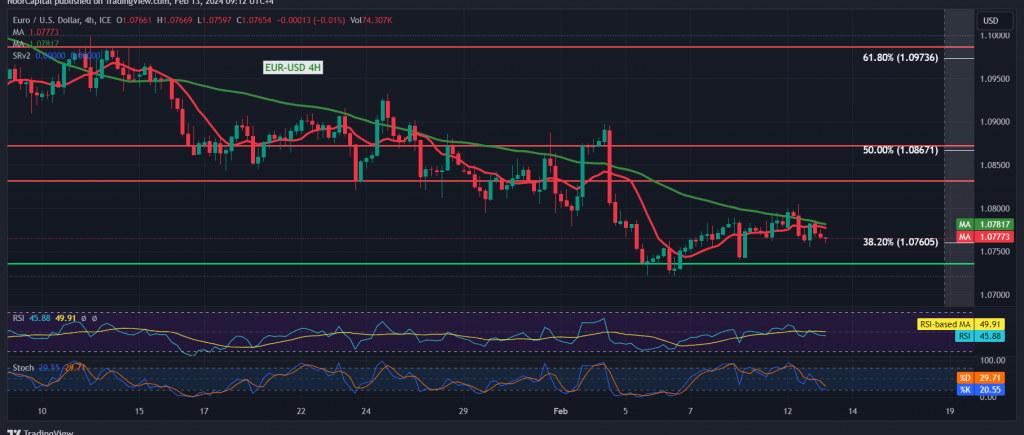
In the early trading sessions of the week, the EUR/USD pair displayed bullish movements, challenging the significant resistance level at 1.0800. However, this psychological barrier prompted a retest of the robust support level at 1.0760, where the pair currently lingers.
Technical Indicators at Odds
Analyzing the 4-hour timeframe chart, the simple moving averages exerted downward pressure on the pair, while the Stochastic indicator hinted at potential upward movement.
Scenarios to Watch
Downward Trend Scenario:
Should the pair breach the 1.0760 support level, marked by the 38.20% Fibonacci retracement, it could target 1.0715 and subsequently 1.0670.
Upward Trend Scenario:
To establish an upward trajectory, the pair must maintain stability above 1.0760 and breach the psychological resistance at 1.0800. Such a breakthrough could pave the way towards 1.0870, corresponding to the 50.0% Fibonacci retracement level.
Caution Ahead of Economic Data
Investors should exercise caution due to the release of high-impact economic data from the American and British economies, including the monthly and annual core CPI from the U.S. and the change in unemployment benefits index from the U.K. Expect heightened price fluctuations during these announcements.
Note: Trading on CFDs involves risks. Therefore, all scenarios may be possible. This article is not a recommendation to buy or sell but rather an explanatory reading of the price movement on the chart.
| S1: |
 Noor Trends News, Technical Analysis, Educational Tools and Recommendations

