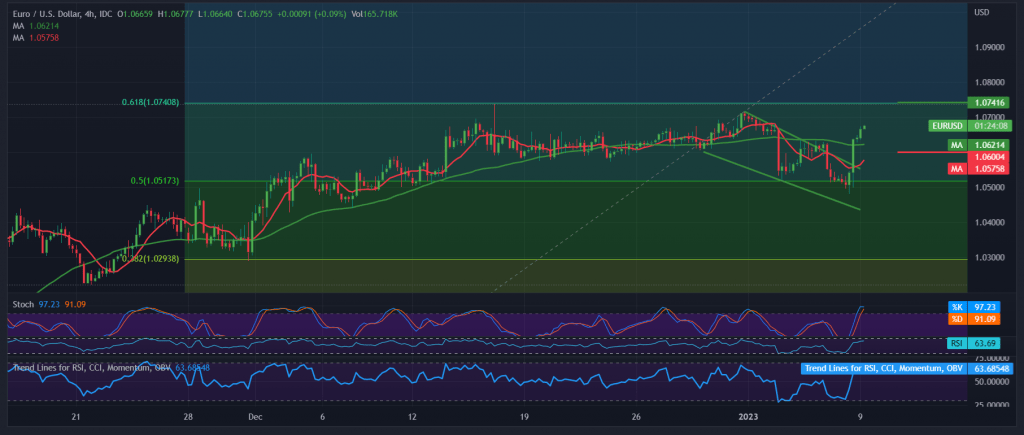
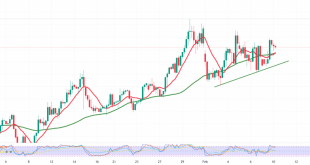
EURUSD pair jumped to achieve strong gains at the end of the trading week last Friday after it managed to exit from the sideways track, as we indicated during all trading reports of the past week, explaining that the price’s consolidation above the resistance level of the psychological barrier 1.0600 opening the door to 1.0670, recording its highest level at 1.0677.
On the technical side today, and upon closer look at the 4-hour chart, we find the simple moving averages supporting the continuation of the bullish daily curve, in addition to the positive signs coming from the momentum indicator on the 60-minute time frame.
With steady daily trading above the resistance level of 1.0600, the bullish scenario remains the most likely, towards the second target of the previous report, 1.0740. However, an expected official stop, represented by a Fibonacci correction of 61.80%, is shown on the chart. Therefore, we must be careful that its breach is a catalyst that increases the chances of touching 1.0810.
A decline below 1.0600 postpones the chances mentioned and puts the pair under negative pressure to retest 1.0540 & 1.0510 before attempting to rise again.
Note: Stochastic is around overbought areas, and we may witness some fluctuation before getting the trend.
Note: Trading on CFDs involves risks. Therefore, all scenarios may be possible. This article is not a recommendation to buy or sell but rather an explanatory reading of the price movement on the chart.
| S1: 1.0545 | R1: 1.0740 |
| S2: 1.0415 | R2: 1.0810 |
| S3: 1.0350 | R3: 1.0935 |
 Noor Trends News, Technical Analysis, Educational Tools and Recommendations

