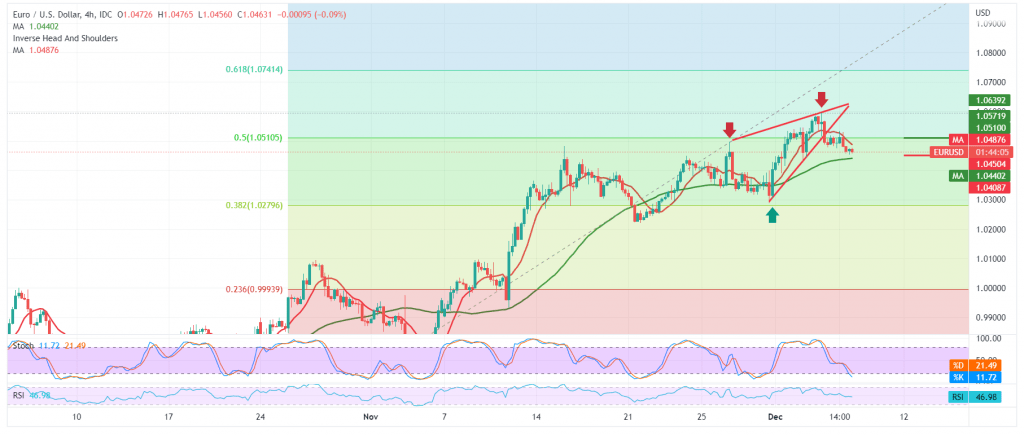
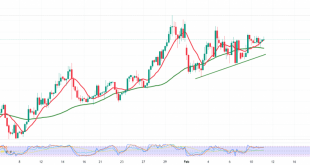
The pair was trading in a narrow range, and the EUR/USD pair did not show any significant change and was stable from above or below the resistance level of 1.0510 and below the support level of 1.0460.
Technically, and with careful consideration, we notice the continuation of the conflicting technical signals; we find the 50-day simple moving average trying to provide a positive motive.
It meets around the support floor of 1.0460 and adds more strength to it, and that may motivate the pair to rise; on the other hand, the stochastic indicator still provides negative signals; in addition, Intraday trading is stable below the strong resistance at 1.0510, 50.0% Fibonacci correction, as shown on the chart.
With conflicting technical signals and trading confined to the levels mentioned above, we prefer to monitor the price behaviour of the pair to be in front of one of the following scenarios:
Consolidation above 1.0510, the 50.0% correction, is a positive factor that enhances the chances of a bullish bias to touch 1.0560 and 1.0600, respectively.
A decline below 10460 and closing an hourly candle below it, puts the EUR/USD pair under negative pressure, targeting 1.0400 and 1.0360 initially.
Note: Trading on CFDs involves risks. Therefore, all scenarios may be possible. This article is not a recommendation to buy or sell but rather an explanatory reading of the price movement on the chart.
| S1: 1.0435 | R1: 1.0510 |
| S2: 1.0405 | R2: 1.0560 |
| S3: 1.0360 | R3: 1.0605 |
 Noor Trends News, Technical Analysis, Educational Tools and Recommendations

