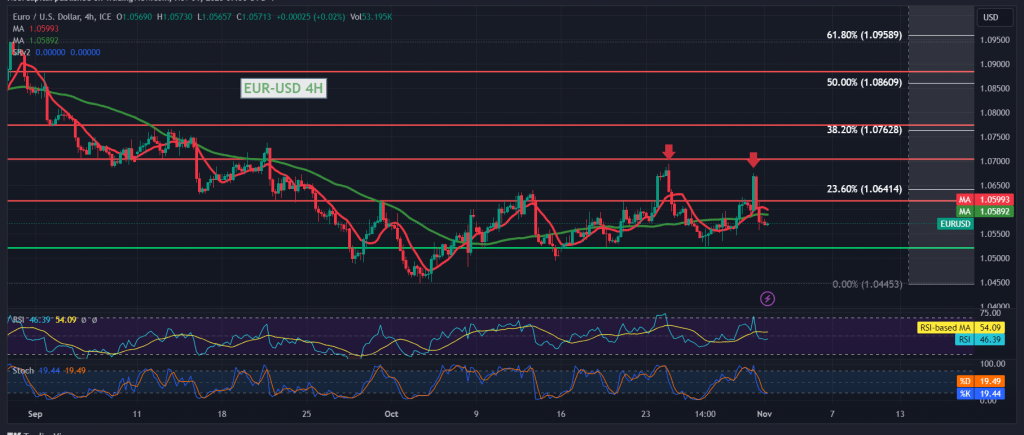
Positive momentum influenced the Euro/Dollar pair’s movements briefly, causing a temporary deviation from the anticipated downward trend. This deviation occurred after the pair consolidated above 1.0600 temporarily, leading to a recovery toward 1.0640 and 1.0670, reaching a peak at 1.0674.
From a technical perspective, the resistance level at 1.0670 exerted significant downward pressure on the pair, compelling it to revert to negative trading and retest 1.0550. Presently, the pair’s movements are stabilizing around its lowest point in the early trading session at 1.0570. Upon closer examination of the 4-hour timeframe chart, it becomes apparent that the euro failed to maintain a sustained position above the psychological barrier of 1.0600. This failure occurred alongside a continued negative crossover from the simple moving averages.
As long as trading remains below 1.0600 and, more broadly, below 1.0640, a bearish trend is highly likely during today’s trading session, with a target set at 1.0530. A breach of this level would ease the path toward 1.0500 and 1.0470, representing official targets that could extend further to 1.0430.
Only a return to stability in trading and price consolidation above 1.0640 would interrupt the proposed bearish scenario. In such a scenario, the Fibonacci correction would halt the bearish outlook, leading the pair to recover and retest 1.0670 (23.60%). Subsequent gains could extend to 1.0720.
A word of caution: Today, we anticipate the release of high-impact economic data from the American economy, including changes in jobs in the private non-agricultural sector, the ISM manufacturing purchasing managers’ index, the Federal Reserve Committee statement, interest rates, and the press conference of the Federal Reserve chairman. Expect significant market volatility upon the release of this news.
Note: Trading on CFDs involves risks. Therefore, all scenarios may be possible. This article is not a recommendation to buy or sell but rather an explanatory reading of the price movement on the chart.
| S1: |
 Noor Trends News, Technical Analysis, Educational Tools and Recommendations

