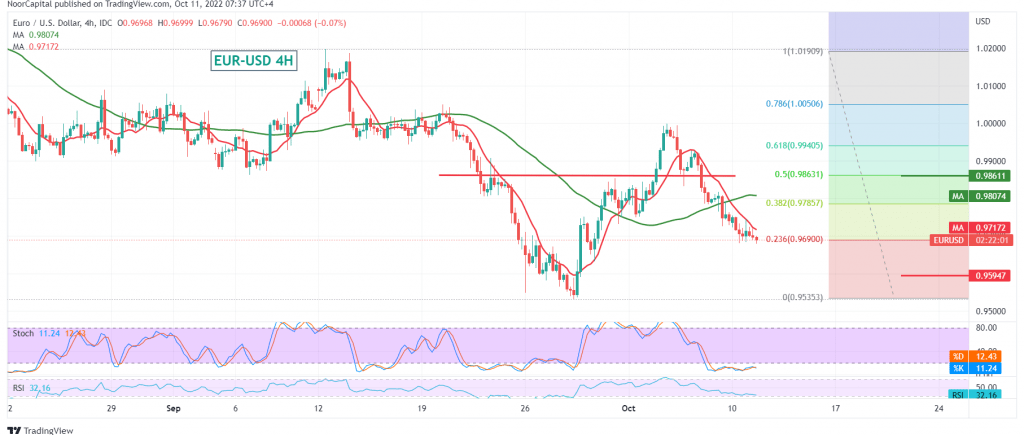
Negative trading dominated the euro’s movements against the US dollar at the beginning of this week’s trading, recording its lowest level at 0.9680.
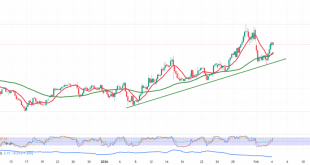
Technically and carefully looking at the 240-minute chart, we notice the continuation of the negative pressure coming from the simple moving averages that support the bearish price curve. This comes in conjunction with a loss of bullish momentum as evident on the stochastic indicator.
The bearish bias is most likely during the day, with the beginning of pressure on the 0.9690 support floor represented by the 23.60% Fibonacci correction as shown on the chart, targeting 0.9630, the target of the first downside wave, knowing that the official targets are around 0.9590 and 0.9550 respectively.
Activating the suggested bearish scenario depends on the stability of the intraday trading below 0.9740 and below the previously broken support that turned into a resistance level at 0.9785, 38.20% correction.
Note: Trading on CFDs involves risks. Therefore, all scenarios may be possible. This article is not a recommendation to buy or sell but rather an explanatory reading of the price movement on the chart.
| S1: 0.9665 | R1: 0.9740 |
| S2: 0.9630 | R2: 0.9785 |
| S3: 0.9595 | R3: 0.9850 |
 Noor Trends News, Technical Analysis, Educational Tools and Recommendations

