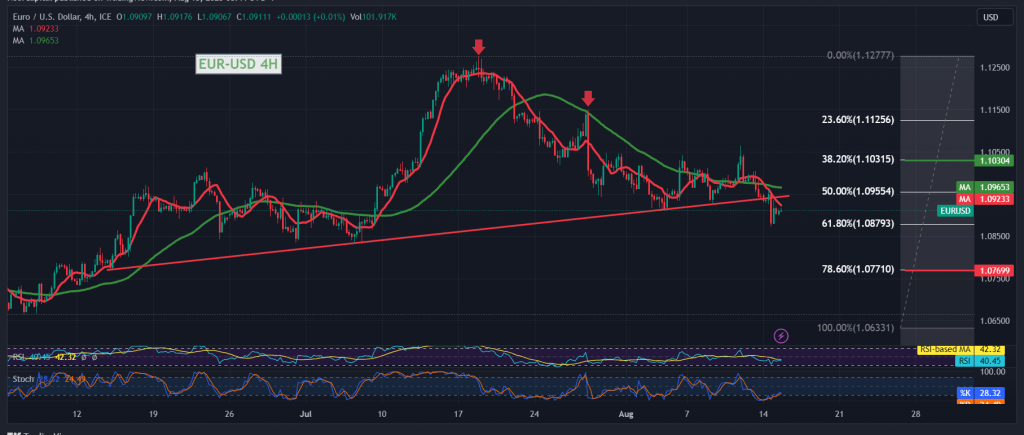
Noticeable declines dominated the Eurodollar pair within the bearish technical outlook, as we expected, in which we relied on breaking the support level at 1.0955, touching the first target at 1.0885, and recording its lowest level at 1.0874.
On the technical side today, and with a closer look at the 240-minute chart, we find that the simple moving averages continue to pressure the price from above and support the daily bearish price curve, in addition to the stability of intraday trading below the broken support level 1.0955 50.0% Fibonacci correction, in addition to the bearish technical formation shown. on the chart.
From here, with the stability of intraday trading below 1.0955, and in general below the main resistance of the current trading levels of 1.1000, correction of 38.20%, the bearish scenario remains the most likely, towards the second objective of the previous technical report 1.0885, correction of 61.80%, and close attention should be paid to this level due to its importance to the long-term general trend. The short one, and breaking it, increases and accelerates the bearish trend’s strength, waiting to touch 1.0845, the next official station whose negative targets might extend later to visit 1.0785.
We remind you that the price’s consolidation once again above 1.1030 completely invalidates the activation of the bearish scenario, and we may witness a retest of 1.1060 & 1.1100.
Note: Today we are awaiting high-impact economic data issued by the US economy “Retail Sales” “New York State Manufacturing Index” and from Canada we await “Monthly Consumer Prices” and from England we await “Change in Unemployment Claims” and we may witness high volatility in prices.
Note: Trading on CFDs involves risks. Therefore, all scenarios may be possible. This article is not a recommendation to buy or sell but rather an explanatory reading of the price movement on the chart.
| S1: |
 Noor Trends News, Technical Analysis, Educational Tools and Recommendations

