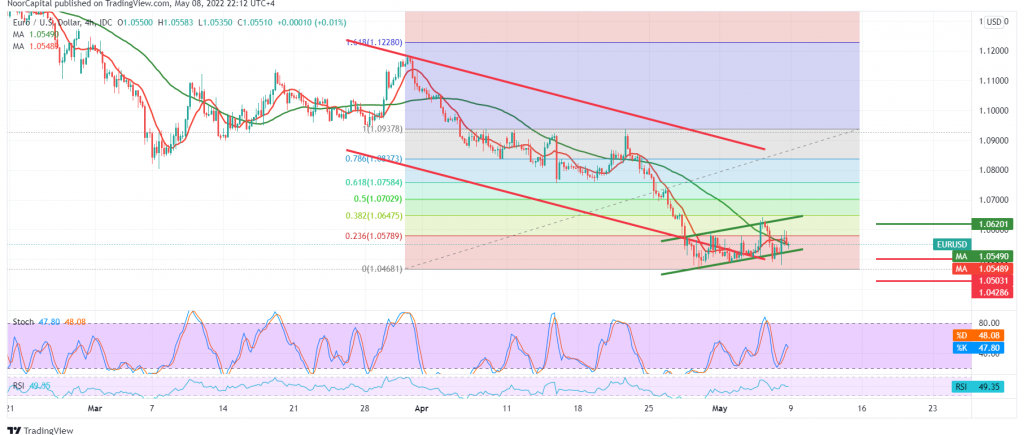
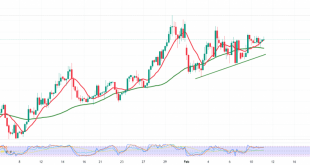
The pivotal supply zones published in Friday analysis at 1.0600 managed to limit the euro’s attempts to rebound upwards, which forced the pair to trade negatively again.
Technically, by looking at the 4-hour chart, we notice the continuation of the negative features coming from the stochastic indicator, which is gradually losing the bullish momentum, and the attempts of the 50-day simple moving average to pressure the price from above.
Despite the technical factors that support the possibility of a decline in the euro against the US dollar, we prefer to witness a clear and strong break of the support level of the psychological barrier of 1.0500, which facilitates the task required to visit 1.0430 next price station towards 1.0370.
if the pair managed to break 1.0500 and surpass the upside of the extended resistance, 1.0620/1.0600 could thwart any attempts to descend and lead the pair to recover to visit 1.0660 and 1.0700, 50.0% Fibonacci correction.
Note: Trading on CFDs involves risks. Therefore, all scenarios may be possible. This article is not a recommendation to buy or sell but rather an explanatory reading of the price movement on the chart.
| S1: 1.0490 | R1: 1.0600 |
| S2: 1.0430 | R2: 1.0660 |
| S3: 1.0370 | R3: 1.0720 |
 Noor Trends News, Technical Analysis, Educational Tools and Recommendations

