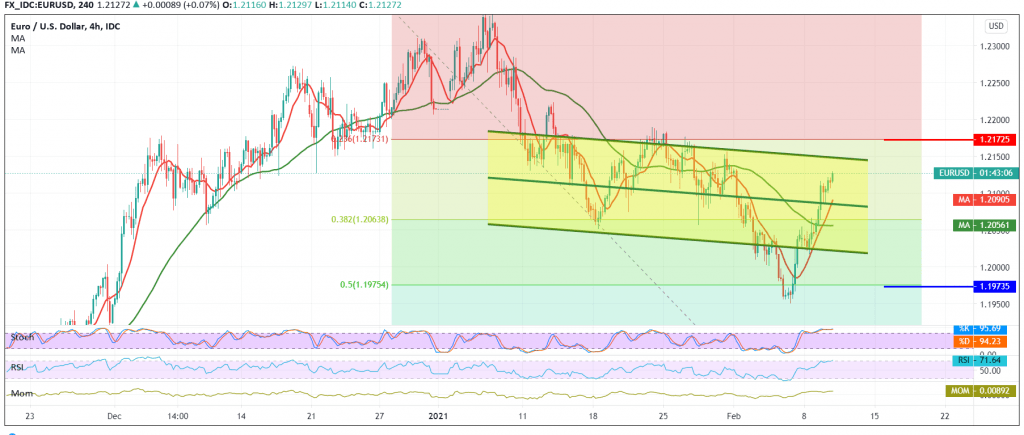
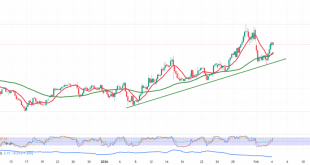
Positive trades dominated the euro’s movements against the US dollar after it succeeded in breaching the resistance level at 1.2065, and then 1.2090, to hit its highest level during the previous session’s trading at 1.2130.
On the technical side today, and by looking at the 240-minute chart, we find the 50-day moving average is still holding the price from below, accompanied by signs that tend to be positive and clear on the RSI.
From here, and with the intraday trading remaining above 1.2085 and in general above the previously breached resistance level converted to the support level of 1.2065 located at the 38.20% Fibonacci retracement, the probability of continuing the rise to retest 1.2175, the 23.60% retracement, as shown on the chart.
From below, confirmation of a break of 1.2065 will stop the current rally and put the price under negative pressure, so we will be waiting for 1.2020, and then 1.1975.
| S1: 1.2065 | R1: 1.2155 |
| S2: 1.2020 | R2: 1.2185 |
| S3: 1.1975 | R3: 1.2235 |
 Noor Trends News, Technical Analysis, Educational Tools and Recommendations

