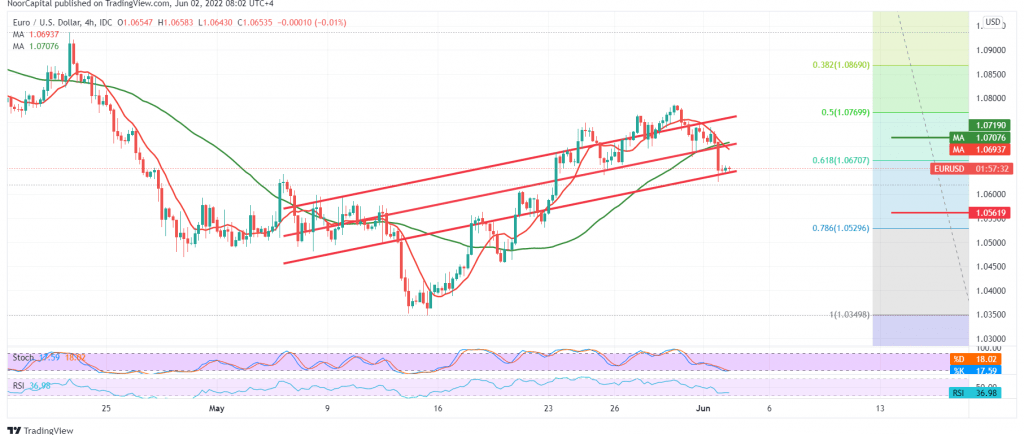
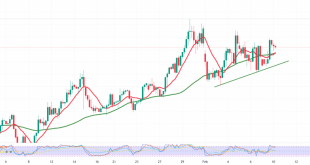
The single European currency declined during the previous session’s trading within the expected bearish path during the last analysis, in which we relied on breaking 1.0670, heading towards touching the first required target at 1.0625, recording its lowest level at 1.0627.
Technically, and by looking at the 4-hour chart, we find the pair stable below 1.0670 represented by the 61.80% Fibonacci correction, with the continuation of moving below the simple moving averages that support the daily bearish price curve.
Therefore, the resumption of the decline is the most likely scenario, knowing that breaking 1.0625 leads the pair to visit 1.0600. We must pay close attention to this level due to its importance for the general trend in the short term, because breaking it extends the losses of the pair so that we are waiting for 1.0560 next station as long as the secret is stable below 1.0720, and most importantly 1.0770 correction 50.0% and surpassing up to the resistance level 1.0770 will stop the bearish scenario and lead the pair to retest 1.0800, and it may extend later towards 1.0840.
Note: Trading on CFDs involves risks. Therefore, all scenarios may be possible. This article is not a recommendation to buy or sell but rather an explanatory reading of the price movement on the chart.
| S1: 1.0600 | R1: 1.0720 |
| S2: 1.0560 | R2: 1.0785 |
| S3: 1.0490 | R3: 1.0830 |
 Noor Trends News, Technical Analysis, Educational Tools and Recommendations

