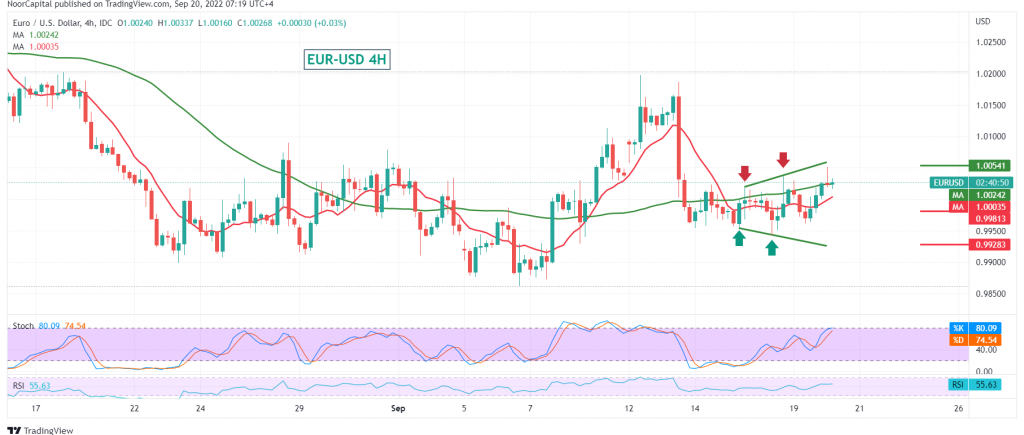
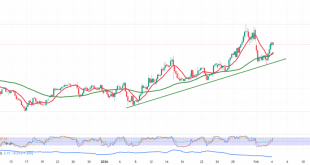
Quiet positive trades dominated the movements of EURUSD with the beginning of the first trading of the current week, to start attacking the resistance level 1.0050, building on the pivot above the parity point 1.0000.
Technically, by carefully looking at the 4-hour chart, we find the 50-day simple moving average trying to push the price to the upside, supporting the limited bullish bias that started yesterday. On the other hand, we find stochastic around the overbought areas.
With the conflicting technical signals, we are waiting for one of the following scenarios:
To confirm the bullish bias, we must witness a clear breach of the price above the resistance level 1.0060/1.0050. This catalyst reinforces entering a minor bullish correction that targets 1.0100 and extends towards 1.0150.
Completing the official bearish path requires witnessing intraday stability below the parity point 1.0000 and most importantly, 0.9980, which facilitates the task required to visit 0.9950 and 0.9930, respectively.
Note: Trading on CFDs involves risks. Therefore, all scenarios may be possible. This article is not a recommendation to buy or sell but rather an explanatory reading of the price movement on the chart.
| S1: 0.9980 | R1: 1.0060 |
| S2: 0.9930 | R2: 1.0100 |
| S3: 0.9895 | R3: 1.0150 |
 Noor Trends News, Technical Analysis, Educational Tools and Recommendations

