
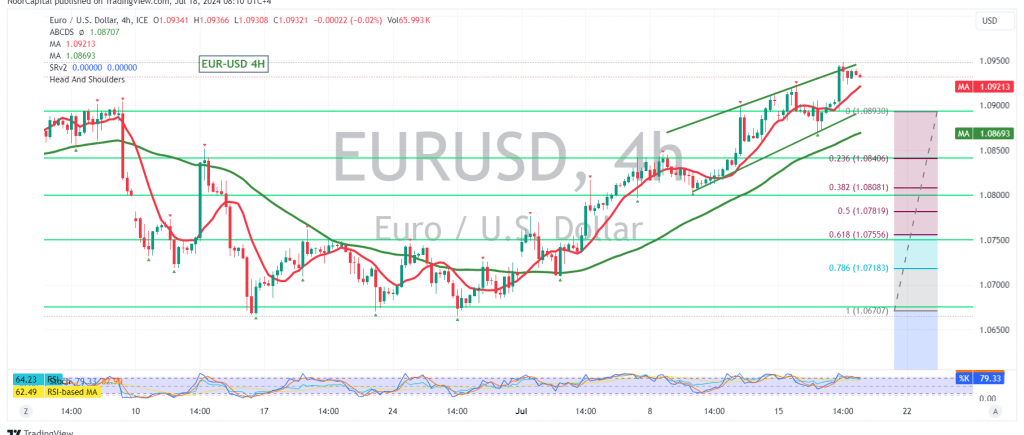
The EUR/USD pair has continued its upward trajectory, reaching our previously identified target of 1.0950 and peaking at 1.0948, confirming the positive outlook outlined in the previous technical report.
Technical Outlook:
The technical outlook remains strongly bullish. On the 4-hour chart, the pair is trading within an ascending price channel, and the simple moving averages (SMAs) are providing continuous positive momentum.
Upward Potential:
With the current bullish momentum and the price holding above the 1.0900 support level, and more importantly above 1.0870, we anticipate further upward movement. The initial target is 1.0950, and a break and consolidation above this level could accelerate the rally towards 1.1000. Further gains towards 1.1040 are possible if the bullish momentum persists.
Downside Risks:
However, traders should remain cautious as a return of trading stability below the 1.0870 support level could trigger a bearish correction, targeting the main support level of 1.0840 (23.60% Fibonacci retracement).
Key Levels:
- Support: 1.0900, 1.0870 (23.60% Fibonacci retracement), 1.0840
- Resistance: 1.0950, 1.1000, 1.1040
Important Note:
The release of high-impact economic data today from the European Central Bank, including the Monetary Policy Committee statement, interest rate decision, and press conference by the President, could induce significant price volatility. Traders should closely monitor the market’s reaction to these announcements.
Warning: The Stochastic oscillator is currently showing signs of negative divergence, which could lead to some short-term fluctuations. However, the overall trend remains bullish as long as the price holds above the key support levels.
Disclaimer: This analysis is for informational purposes only and should not be considered as financial advice.
Disclaimer: Trading in CFDs carries inherent risks. The analysis provided herein is not a recommendation to buy or sell, but rather an interpretation of the current price movement on the chart.
| S1: |