
The EUR/USD pair experienced narrow sideways movement in the previous session, as we maintained our neutral stance due to conflicting technical signals.
Technical Outlook:
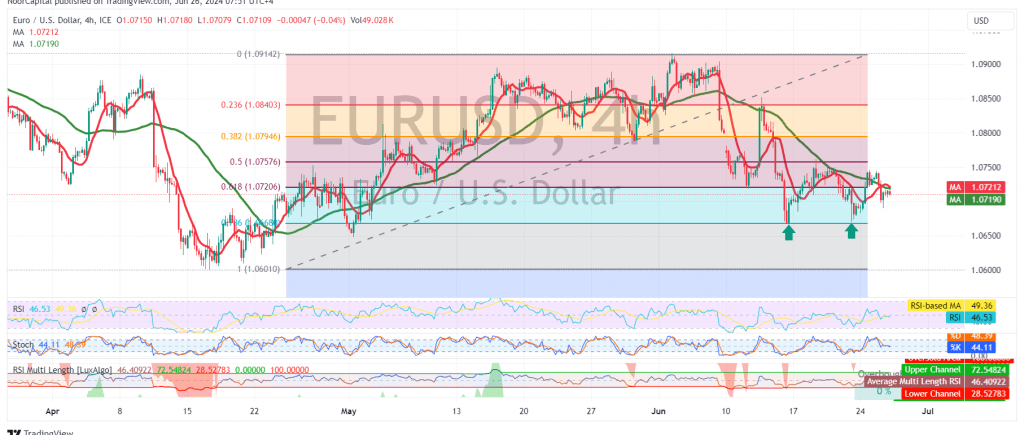
On the 240-minute chart, the pair is currently holding above the 1.0690 level and the main support level at 1.0675. This suggests the potential formation of a bullish double bottom pattern. However, the price remains below the 1.0720 resistance level (61.80% Fibonacci retracement), which coincides with the 50-day simple moving average (SMA) acting as a strong barrier.
Conflicting Signals and Potential Scenarios:
With the continuation of conflicting technical signals, we recommend monitoring the price action closely. Two scenarios are possible:
- Upward Breakout: A clear and strong break above the 1.0720 resistance level would confirm a bullish trend. This could lead to a move towards 1.0760 (50.0% Fibonacci retracement), followed by 1.0800/1.0795, and potentially extending to 1.0840.
- Downward Breakout: A break below the 1.0690 support level, and more importantly, below the 1.0675 main support, would confirm a bearish trend. This could result in a decline towards 1.0630 and 1.0600.
Key Levels:
- Resistance: 1.0720 (61.80% Fibonacci retracement), 1.0760 (50.0% Fibonacci retracement), 1.0800/1.0795, 1.0840
- Support: 1.0690, 1.0675, 1.0630, 1.0600
Disclaimer: Trading in CFDs carries inherent risks. The analysis provided herein is not a recommendation to buy or sell, but rather an interpretation of the current price movement on the chart.
| S1: |